


The new bottleneck for AI at work isn't the tech, it's the people.
A massive new report from Wharton and GBK Collective shows that AI has officially moved from the playground to the payroll. After three years of tracking over 800 enterprise leaders, the story is clear: companies are no longer just experimenting; they're demanding results, measuring ROI, and putting executives in charge.
Meanwhile, Scale AI and CAIS just released the Remote Labor Index (paper), a new benchmark where AI agents attempted real freelance tasks. The best-performing model earned just $1,810 out of $143,991 in available work, and yes, finishing only 2-3% of jobs.
Here's the TL;DR on both report's findings:
The Wharton paper says the AI story for 2025 is now about accountability. The "wow" factor of 2023 is gone, replaced by the hard numbers of 2025. Nearly three-quarters (72%) of companies are now formally measuring the ROI of their AI investments, with most already seeing positive returns. This shift is being driven from the top down, as executive leadership of AI strategy has surged and 60% of enterprises now have a Chief AI Officer (CAIO) or equivalent.
Here’s a snapshot of how fast things have changed:
- Daily Habit: Nearly half (46%) of business leaders now use Gen AI every day, a massive 17-point jump from last year.
- Budget Boom: A staggering 88% of companies plan to increase their AI budgets in the next 12 months.
- In-House Focus: A huge chunk of tech budgets (30%) is now being funneled into internal R&D, signaling a move toward building custom, high-ROI AI solutions.
But people are the new bottleneck. While companies are all-in on the tech, the report flags a critical new problem: skill atrophy. As employees rely more on AI for core tasks, 43% of leaders are worried that their teams' underlying skills will decline. Think of it like using a calculator for so long you forget how to do long division—but for critical business skills.
What to do: This report signals a major strategy shift for both companies and professionals.
- For leaders and founders: Your focus must pivot from just deploying tools to actively managing human capital. The new priority is building a robust training pipeline that doesn't just teach employees how to use AI, but also reinforces the core skills that AI is augmenting. You're no longer just buying software; you're managing a hybrid human-AI workforce, and you need to prevent the human side from getting rusty.
- For professionals: The message is clear: Using AI is now a basic work competency, not a niche skill. But simply using it isn't enough. You need to become the person who can critically evaluate, refine, and improve upon AI-generated outputs. Your long-term value will come from the skills AI can't easily replicate. The biggest career risk is not being replaced by AI, but becoming so reliant on it that your own expertise fades.
At the same time, fully "agentic" AI just took its first real-world performance review... and it basically got fired.
Just as the business world gets comfortable with AI as a daily sidekick, the Remote Labor Index (RLI) threw frontier AI agents into the deep end, asking them to complete real, paid freelance jobs from platforms like Upwork.
The results were abysmal. The best-performing agent, Manus, managed to complete just 2.5% of projects. Translation? Out of $143,991 worth of freelance work up for grabs, it earned a measly $1,720.
This isn't a gotcha moment; it's a much-needed dose of reality. The RLI tested AI on 240 complex, real-world gigs that take a human pro an average of 29 hours and cost over $600 each. We're talking about tasks that require end-to-end skill, like:
- Creating 3D product renders and architectural models.
- Producing animated explainer videos.
- Developing a complete, physics-based web game.
The AI agents failed spectacularly, not because of subtle errors, but because of fundamental breakdowns. The most common issues were simply poor quality work (45.6%), submitting incomplete projects (35.7%), and delivering corrupted, unusable files (17.6%). Think an 8-second video when the client asked for 8 minutes. Oops.
The few bright spots? The agents did well on narrow creative tasks where modern generative tools already excel, like audio editing, generating ad images, and writing simple data reports.
The bottom line is this: Both reports together reveal a massive gap between AI's ability to assist with a task and its ability to autonomously own a complex project. While other reports show companies are getting great ROI from using AI as a productivity booster, the RLI proves that the dream of a fully autonomous AI workforce is still a long, long way off.
Below we dive into both of the report's key findings and sections.
Our Deep Dive On The Wharton Report
The Honeymoon is Over... Three years after ChatGPT ignited the generative AI revolution, the corporate world has moved decisively beyond fascination and into a new era of “accountable acceleration.” A comprehensive new annual report from Wharton Human-AI Research and GBK Collective, titled "Gen AI Fast-Tracks into the Enterprise," provides the clearest picture yet of this maturation. Drawing on surveys from over 800 senior decision-makers at large U.S. companies, the study reveals that AI is no longer a speculative toy but a deeply embedded, rigorously measured component of daily operations.
The findings are stark: AI usage is mainstream now, ROI is king, and the C-suite is firmly in control. However, this rapid integration has exposed a new, more complex challenge that technology alone cannot solve. The primary bottleneck for AI’s long-term success has shifted from software and systems to people, with growing concerns over employee skill atrophy, inadequate training, and the strategic alignment of human capital.
From Exploration to Everyday: AI is Now Business as Usual
The report’s year-over-year data paints a dramatic picture of AI’s normalization in the workplace. In 2023, the landscape was one of "Exploration," with a respectable 37% of leaders using AI weekly. By 2025, that figure has skyrocketed to 82%. More significantly, daily usage has become the norm for nearly half of all business leaders (46%), a staggering 17-percentage-point jump from 2024 alone.
From the Accountable Acceleration: Gen AI Fast-Tracks Into the Enterprise Wharton report
This isn't just casual use; it's a deep integration into core workflows. The most common applications are centered on practical, repeatable tasks that drive immediate productivity gains:
- Data analysis and analytics (73%)
- Document and meeting summarization (70%)
- Document and proposal editing/writing (68%)
These top use cases are also rated as the highest-performing, indicating that companies have successfully identified and scaled the "low-hanging fruit" of AI-driven efficiency. The adoption curve is also broadening, with specialized functions developing their own power uses, such as code generation in IT, employee recruitment in HR, and legal contract generation in Legal departments.
From the Accountable Acceleration: Gen AI Fast-Tracks Into the Enterprise Wharton report
The adoption is not uniform, however. A clear divide persists between industries. Tech/Telecom, Banking/Finance, and Professional Services have become super-users, with 90% or more of leaders engaging with AI weekly. In contrast, sectors with more complex physical operations, like Manufacturing and Retail, are lagging. Similarly, a gap in perspective exists between seniority levels. Executives at the VP level and above are far more bullish on their company's adoption speed, with 56% believing they are "much faster" than competitors, compared to a more grounded 28% of mid-managers.
Proving Value: The Shift from FOMO to Financial Scrutiny
The central theme of the 2025 Wharton/GBK Collective report is the enterprise pivot from speculative adoption to a rigorous, disciplined pursuit of value. If 2023 and 2024 were driven by a mix of excitement and fear of missing out (FOMO), 2025 is defined by a demand for accountability. The report reveals a seismic shift toward structured, business-linked ROI measurement. A remarkable 72% of enterprises now formally track the return on their Gen AI investments, a clear sign that the era of speculative spending is over.
Wharton writes this has ushered in an era of "accountable acceleration," where nearly every aspect of AI investment is now viewed through the lens of measurable return.
And for most, the returns are already materializing. Nearly three-quarters (74%) of leaders report a positive ROI to date, and four in five are confident they will see positive returns within the next two to three years. This confidence is fueling continued investment, with 88% of organizations planning to increase their Gen AI budgets in the next 12 months.
This spending is also becoming more strategic. Budgets are pivoting from scattered, one-off pilots to performance-justified programs. A significant portion—30% of technology budgets, according to IT leaders—is now being allocated to internal R&D. This signals a strategic move away from off-the-shelf tools and toward developing custom, proprietary AI solutions designed to solve specific business problems and create a durable competitive advantage.
Furthermore, while most AI funding is still from net-new budgets, a growing minority (11%, up 7 points from last year) are now reallocating funds from other areas, primarily legacy IT systems and traditional HR programs. This disciplined approach underscores that AI is no longer a peripheral experiment but a core strategic priority that must justify its existence on the balance sheet.
Budgets Grow and Become More Strategic
Confidence in Gen AI's long-term value is directly reflected in corporate budgets. A striking 88% of enterprise leaders expect their Gen AI spending to increase in the next 12 months—a 16-percentage-point jump from 2024. Nearly two-thirds of these organizations are budgeting $5 million or more for their initiatives.
The spending is heavily concentrated in larger firms, with 23% of Tier 1 enterprises ($2B+ revenue) investing $20 million or more. The allocation of these funds reveals a strategic shift:
- Technology Investment: Over a third of budgets (38%) are dedicated to acquiring new AI technology (21%) and maintaining existing systems (17%).
- Internal R&D: A significant 30% of technology-specific budgets are now funneled into internal research and development, according to IT leaders. This indicates a clear move toward building customized, proprietary AI solutions to gain a competitive edge rather than relying solely on off-the-shelf products.
- Budget Reallocation: While most AI funding is from net-new budgets, a growing minority of companies (11%, up 7 points YoY) are now reallocating funds from other areas—primarily from legacy IT systems and traditional HR and workforce programs—to fuel their AI ambitions.
Measurement Becomes Standard Practice
The era of funding AI on faith is over. The report shows that a vast majority of firms (72%) have now implemented formal processes to measure the ROI of their Gen AI investments. This practice is most mature in functions with historically strong metrics cultures, such as HR (84% measure ROI) and Finance (80%).
Organizations are tracking a variety of business-linked metrics, with the most common being:
- Employee Engagement/Productivity (47%).
- Profitability/Losses Specific to Gen AI (46%).
- Changes in Employee Performance Post-Training (42%).
- Operational Throughput/Efficiency Gains (42%).
The Verdict: Positive Returns Are Emerging
For most enterprises, the investments are already paying off. Nearly three-quarters (74%) report seeing a positive ROI from their Gen AI initiatives to date. However, the scale and speed of these returns vary significantly.
- By Company Size: Smaller, more agile firms are realizing returns faster. A quarter of Tier 1 enterprises (25%) state it is "too early to tell," citing the complexities of large-scale integration, whereas smaller Tier 2 and Tier 3 firms report quicker positive outcomes.
- By Industry: The divide between digital and physical operations is stark. Industries deeply rooted in digital workflows report the strongest returns, including Tech/Telecom (88% positive ROI), Banking/Finance (83%), and Professional Services (83%). In contrast, sectors with complex physical supply chains and operations, like Retail (54% positive ROI) and Manufacturing (75%), are still in the earlier stages of proving value.
- By Seniority: A notable perception gap exists within management. VP-level and C-suite executives are significantly more optimistic, with 81% seeing positive ROI, compared to 69% of mid-managers. 45% of senior leaders believe their ROI is "significantly positive," a view shared by only 27% of their mid-level counterparts.
This widespread positive sentiment is fueling confidence in the future, with four out of five leaders expecting their organization to achieve positive ROI from AI within the next two to three years. This underpins the consensus that AI is becoming an essential, value-creating driver of day-to-day efficiency and long-term growth.
The Great Divide: How AI is Creating a Tale of Two Industries
The report makes one other thing abundantly clear: the Gen AI revolution is not being evenly distributed. A significant performance gap has emerged between digitally native industries and those with deep roots in physical operations.
On one side are the clear leaders: Technology/Telecom, Banking/Finance, and Professional Services. In these sectors, AI is not just an ancillary tool but a core operational engine. A staggering 90% or more of leaders in these industries use Gen AI on a weekly basis. This high frequency of use translates directly to financial results. Tech/Telecom leads the pack with 88% of firms reporting a positive ROI, closely followed by Banking and Professional Services, both at 83%. This success fuels a virtuous cycle of optimism and investment; leaders in these fields are the most likely to believe AI will be "revolutionary" and are allocating the largest budgets (often exceeding $10 million) to maintain their lead.
On the other side are the laggards: Manufacturing and Retail. These industries face a more complex path to adoption, and the data reflects their caution. Leaders in these sectors are far more likely to be infrequent users, and their ROI figures tell a story of a longer, more arduous journey. While Manufacturing is making steady progress with 75% reporting positive ROI, Retail is struggling significantly, with only 54% seeing positive returns so far. This slower pace is mirrored in their leadership's sentiment; just 12% of retail leaders believe AI will be "revolutionary," indicating that the path from potential to proven value is still being paved.
The Playbook for Success: Which AI Tasks Are Actually Delivering Value?
As enterprises move past broad experimentation, a clear playbook for high-value AI implementation has emerged. Success is overwhelmingly concentrated in tasks that enhance employee productivity and streamline core business processes.
The top three most adopted use cases across all industries are foundational office tasks: data analysis (73%), document/meeting summarization (70%), and document editing (68%). Crucially, the report notes a direct linear relationship between usage frequency and performance. The tasks companies are doing the most are the ones delivering the best results, a sign of a maturing and optimizing ecosystem.
Beyond these general applications, specific functions have become "super-users," tailoring AI for highly specialized, high-impact tasks. The report highlights several key examples:
- IT Departments are leveraging AI for presentation and report creation at a rate that is 24% higher than the average, and for code generation at a rate 23% higher.
- Human Resources has found a killer app in employee recruitment and onboarding, with usage indexing a massive 29% above the enterprise average.
- Legal Teams are seeing transformative results from AI-powered legal contract generation, a use case so effective its adoption indexes 33% higher than average.
This trend extends to the rise of AI Agents, with 58% of organizations now deploying these autonomous systems for tasks like process automation and frontline customer support, further embedding AI into the operational fabric of the business.
The Human Element: Navigating the New Landscape of Jobs, Training, and Skills
As the technological and financial aspects of AI adoption mature, the report’s most critical finding comes into focus: people are now the primary constraint. Organizational readiness—encompassing leadership, workforce skills, and change management—is the new frontier where the battle for AI supremacy will be won or lost.
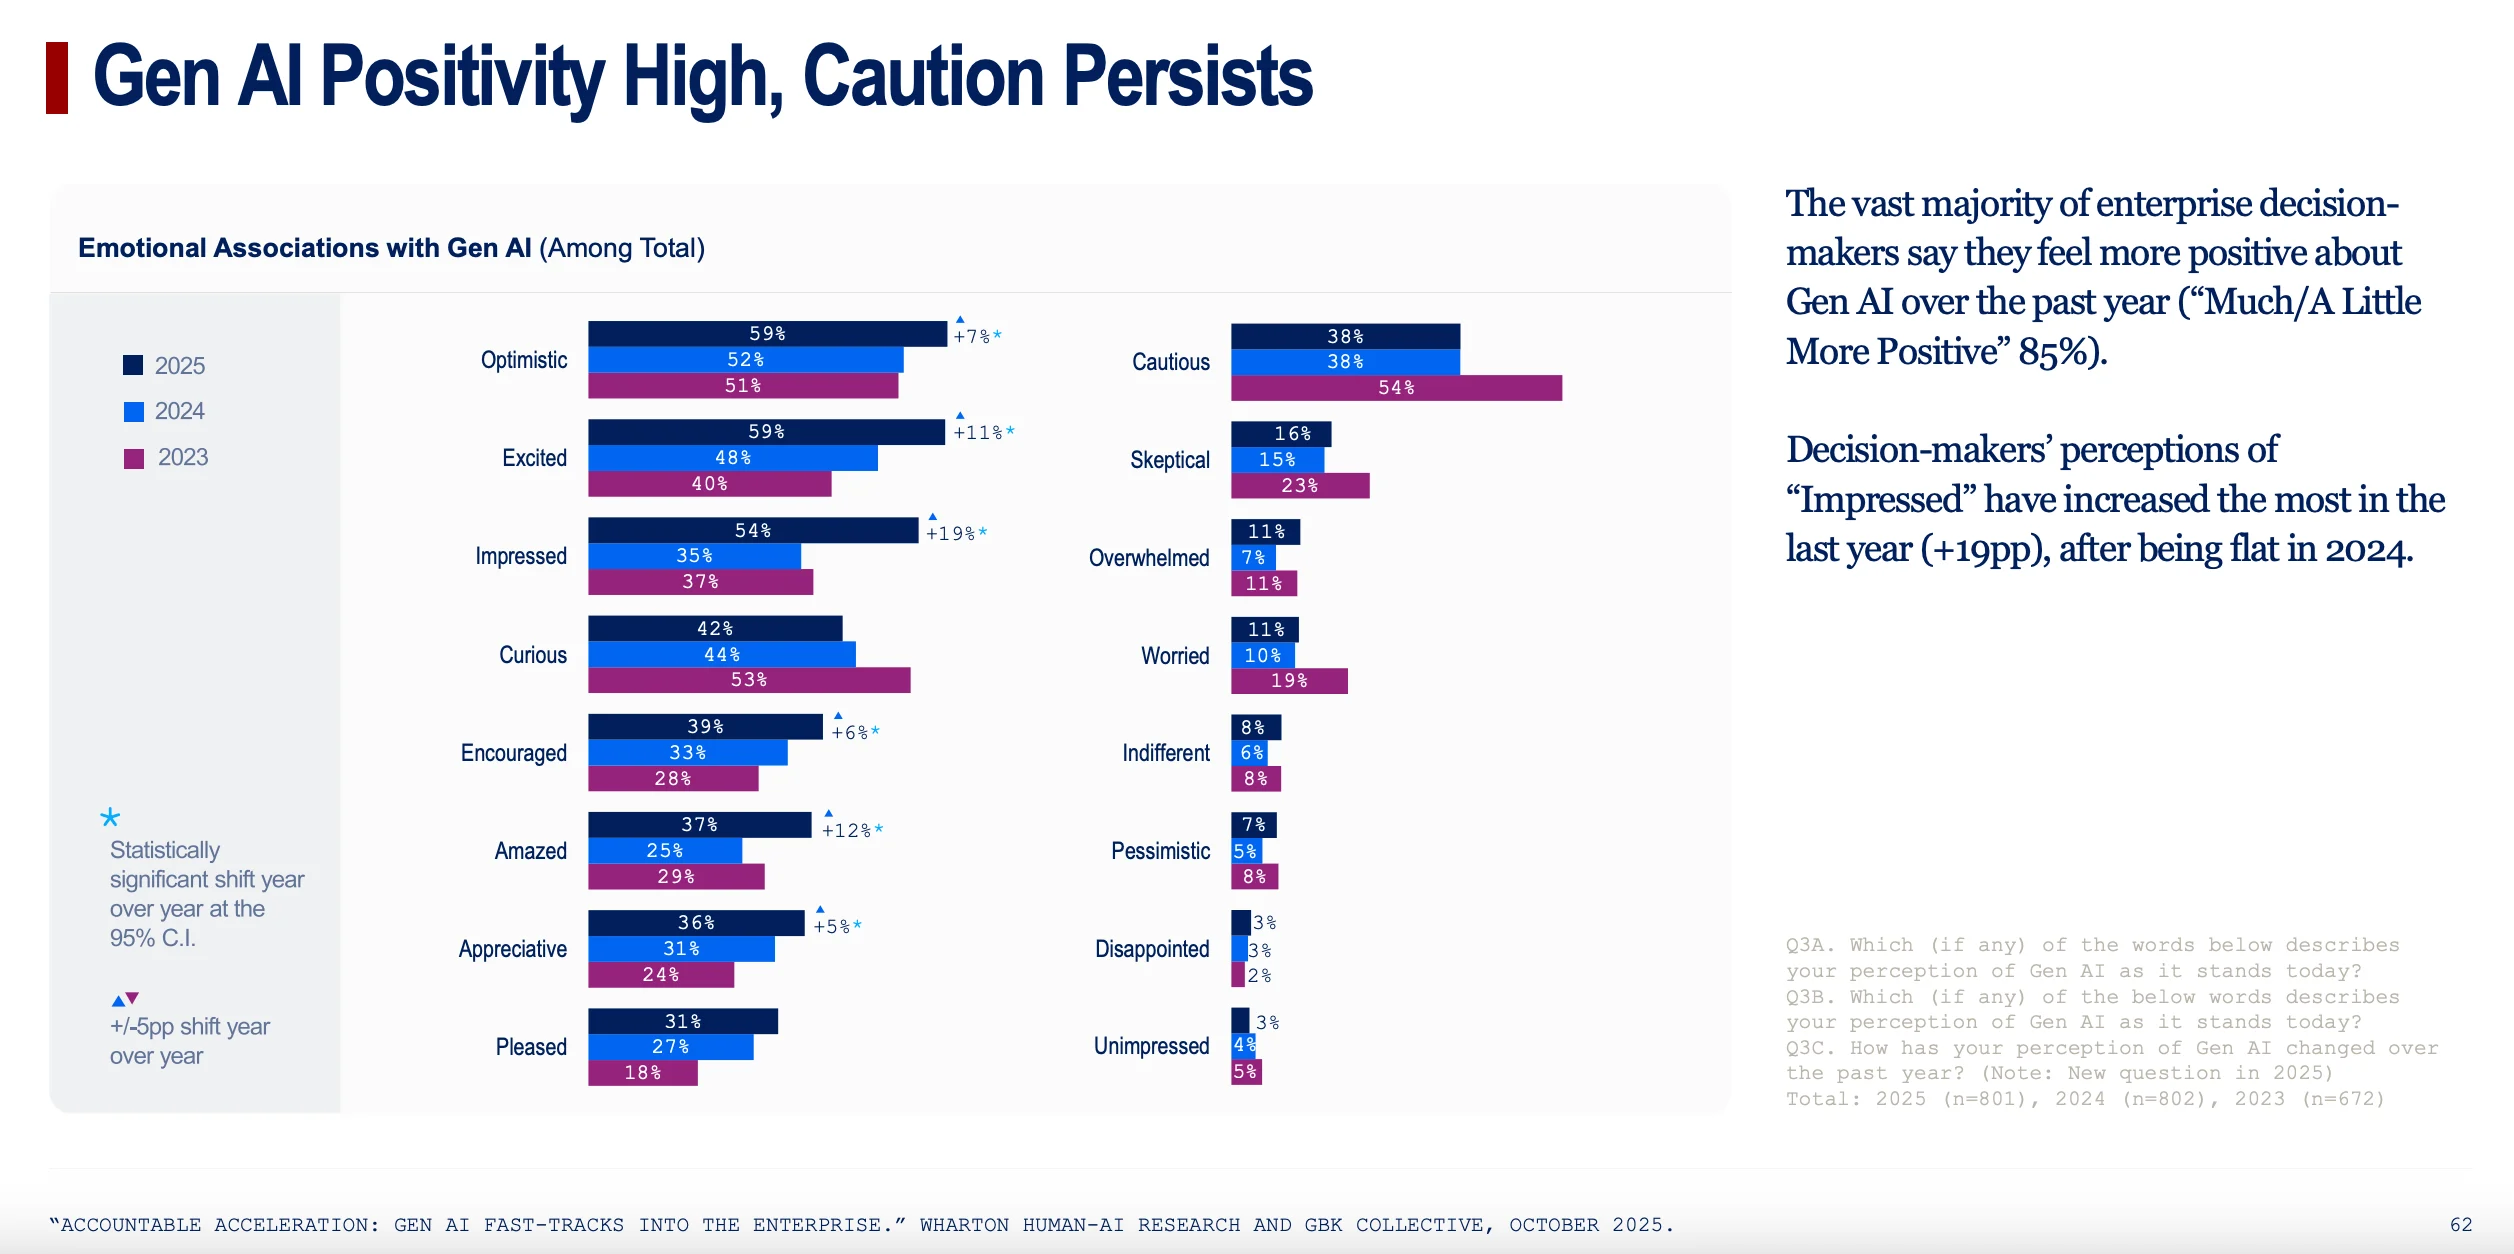
While the vast majority of enterprise leaders (85%) feel more positive about Gen AI than they did a year ago, with perceptions of being "Impressed" jumping a massive 19 points, a persistent sense of "Caution" remains for 38% of them. This duality captures the core tension: excitement about the technology is tempered by the profound challenges of managing its human impact.
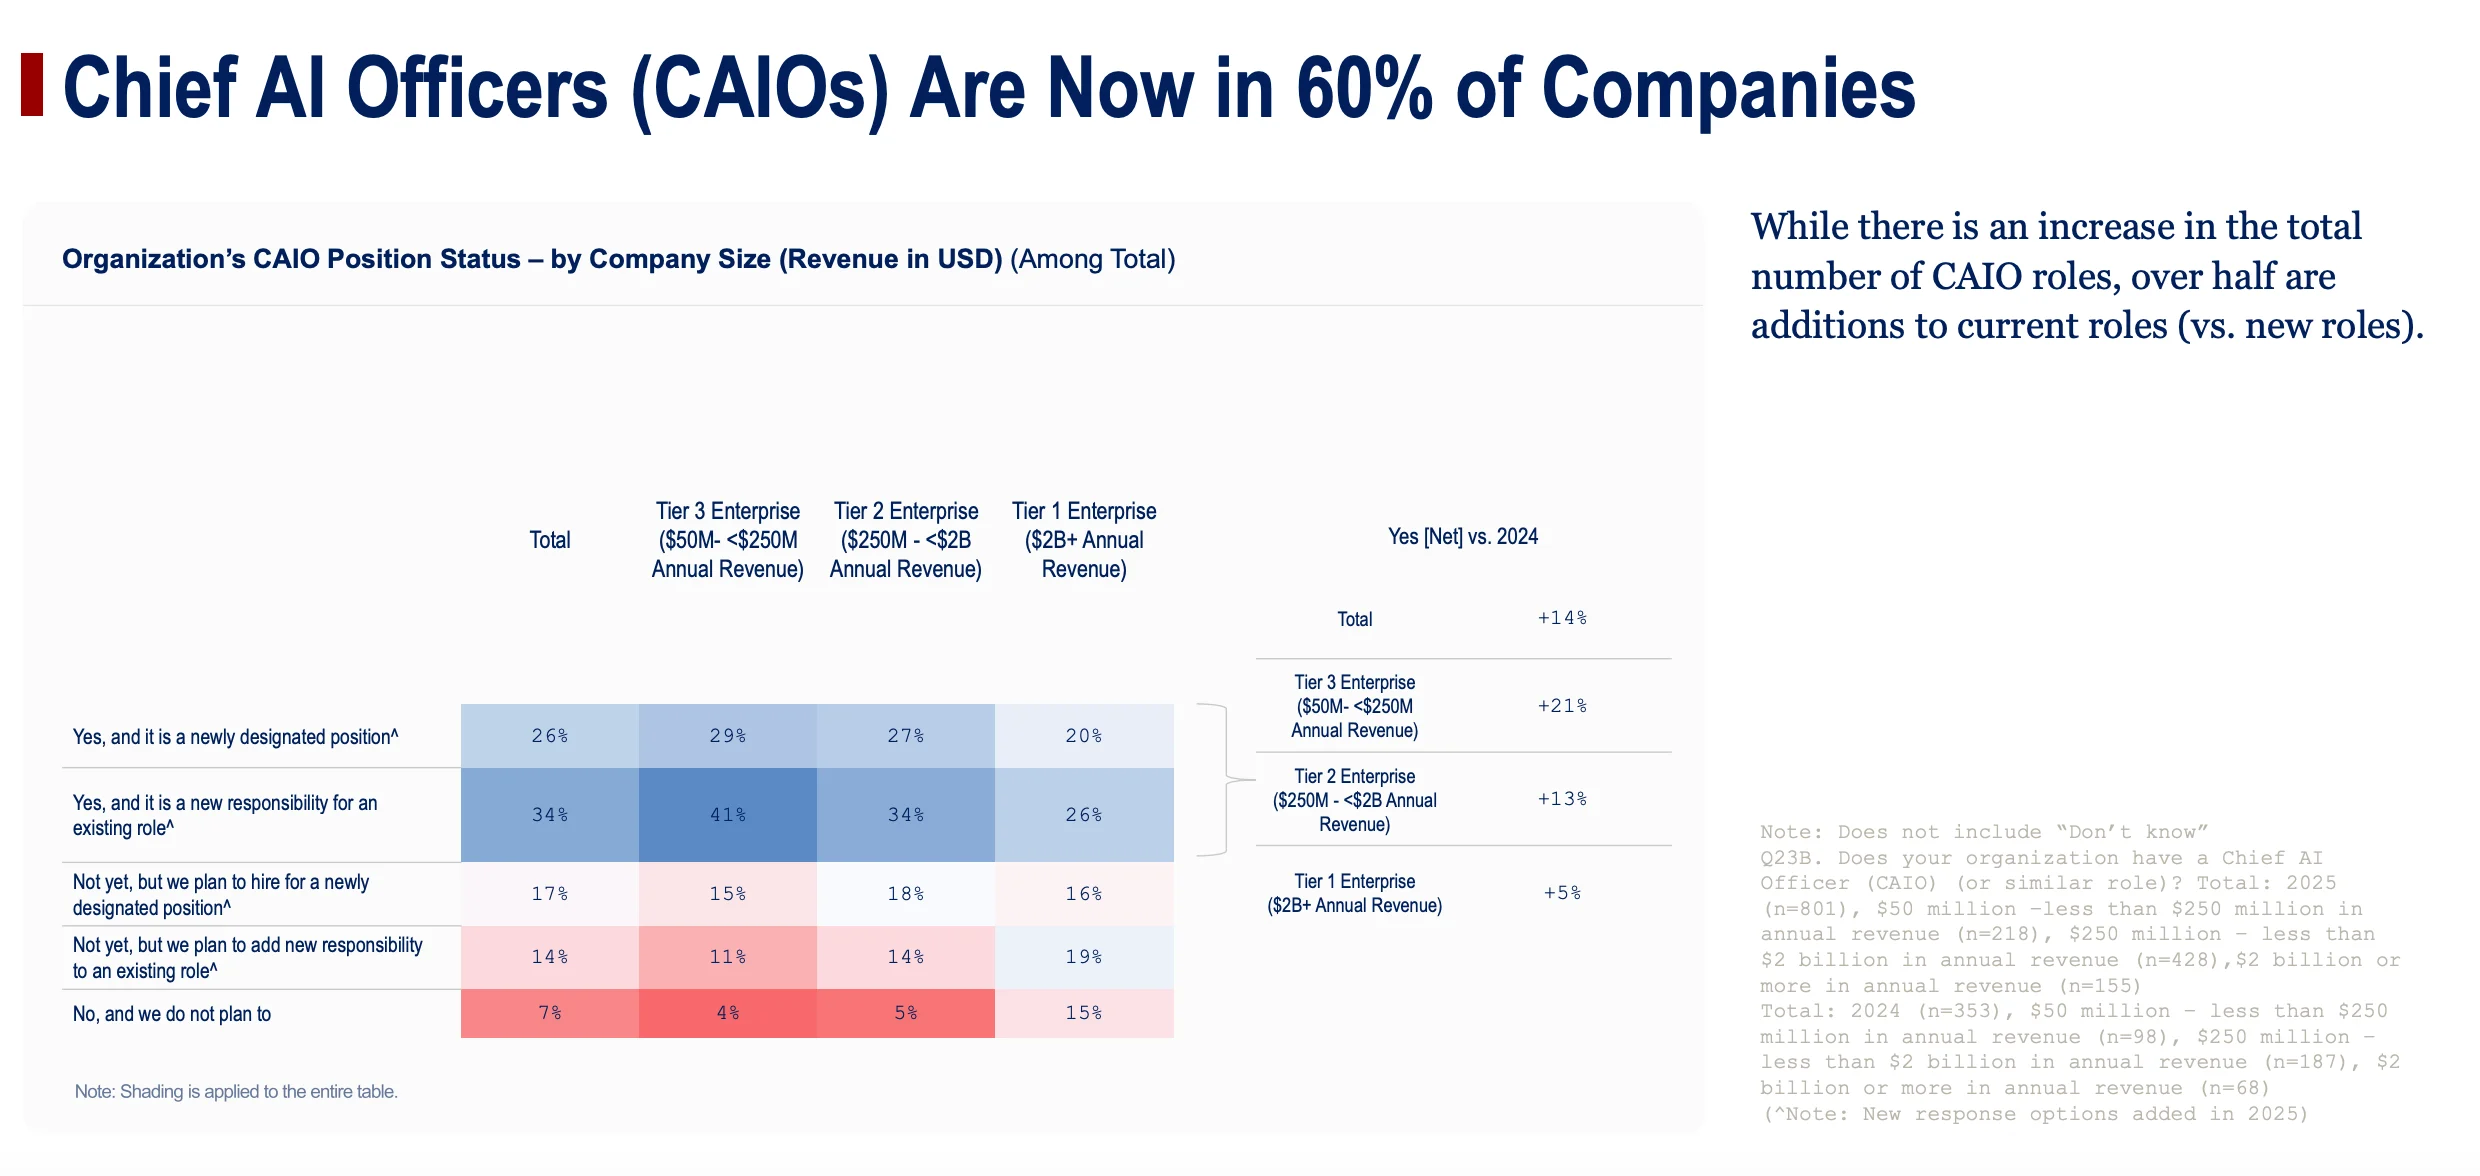
Leadership has firmly stepped up to the plate. Gen AI strategy is no longer relegated to individual departments; it has moved decisively into the C-suite. Executive-led adoption has surged, and the once-novel role of Chief AI Officer (CAIO) is now a reality in 60% of enterprises. This top-down ownership is a clear signal that AI is being treated as a core strategic function, though strategy itself remains a team effort, often consolidated within one existing executive or IT leadership team rather than being driven by a single individual.
Yet, this strategic clarity at the top is not matched by capability-building on the ground. The report exposes a dangerous mismatch between ambition and execution in talent development, giving rise to its most alarming revelation: the risk of skill atrophy. As employees increasingly outsource cognitive tasks to AI, a substantial 43% of leaders are concerned that their teams' fundamental skills will decline. This creates a paradox where a tool meant to augment human intelligence could inadvertently erode it over time, leaving the workforce more vulnerable.
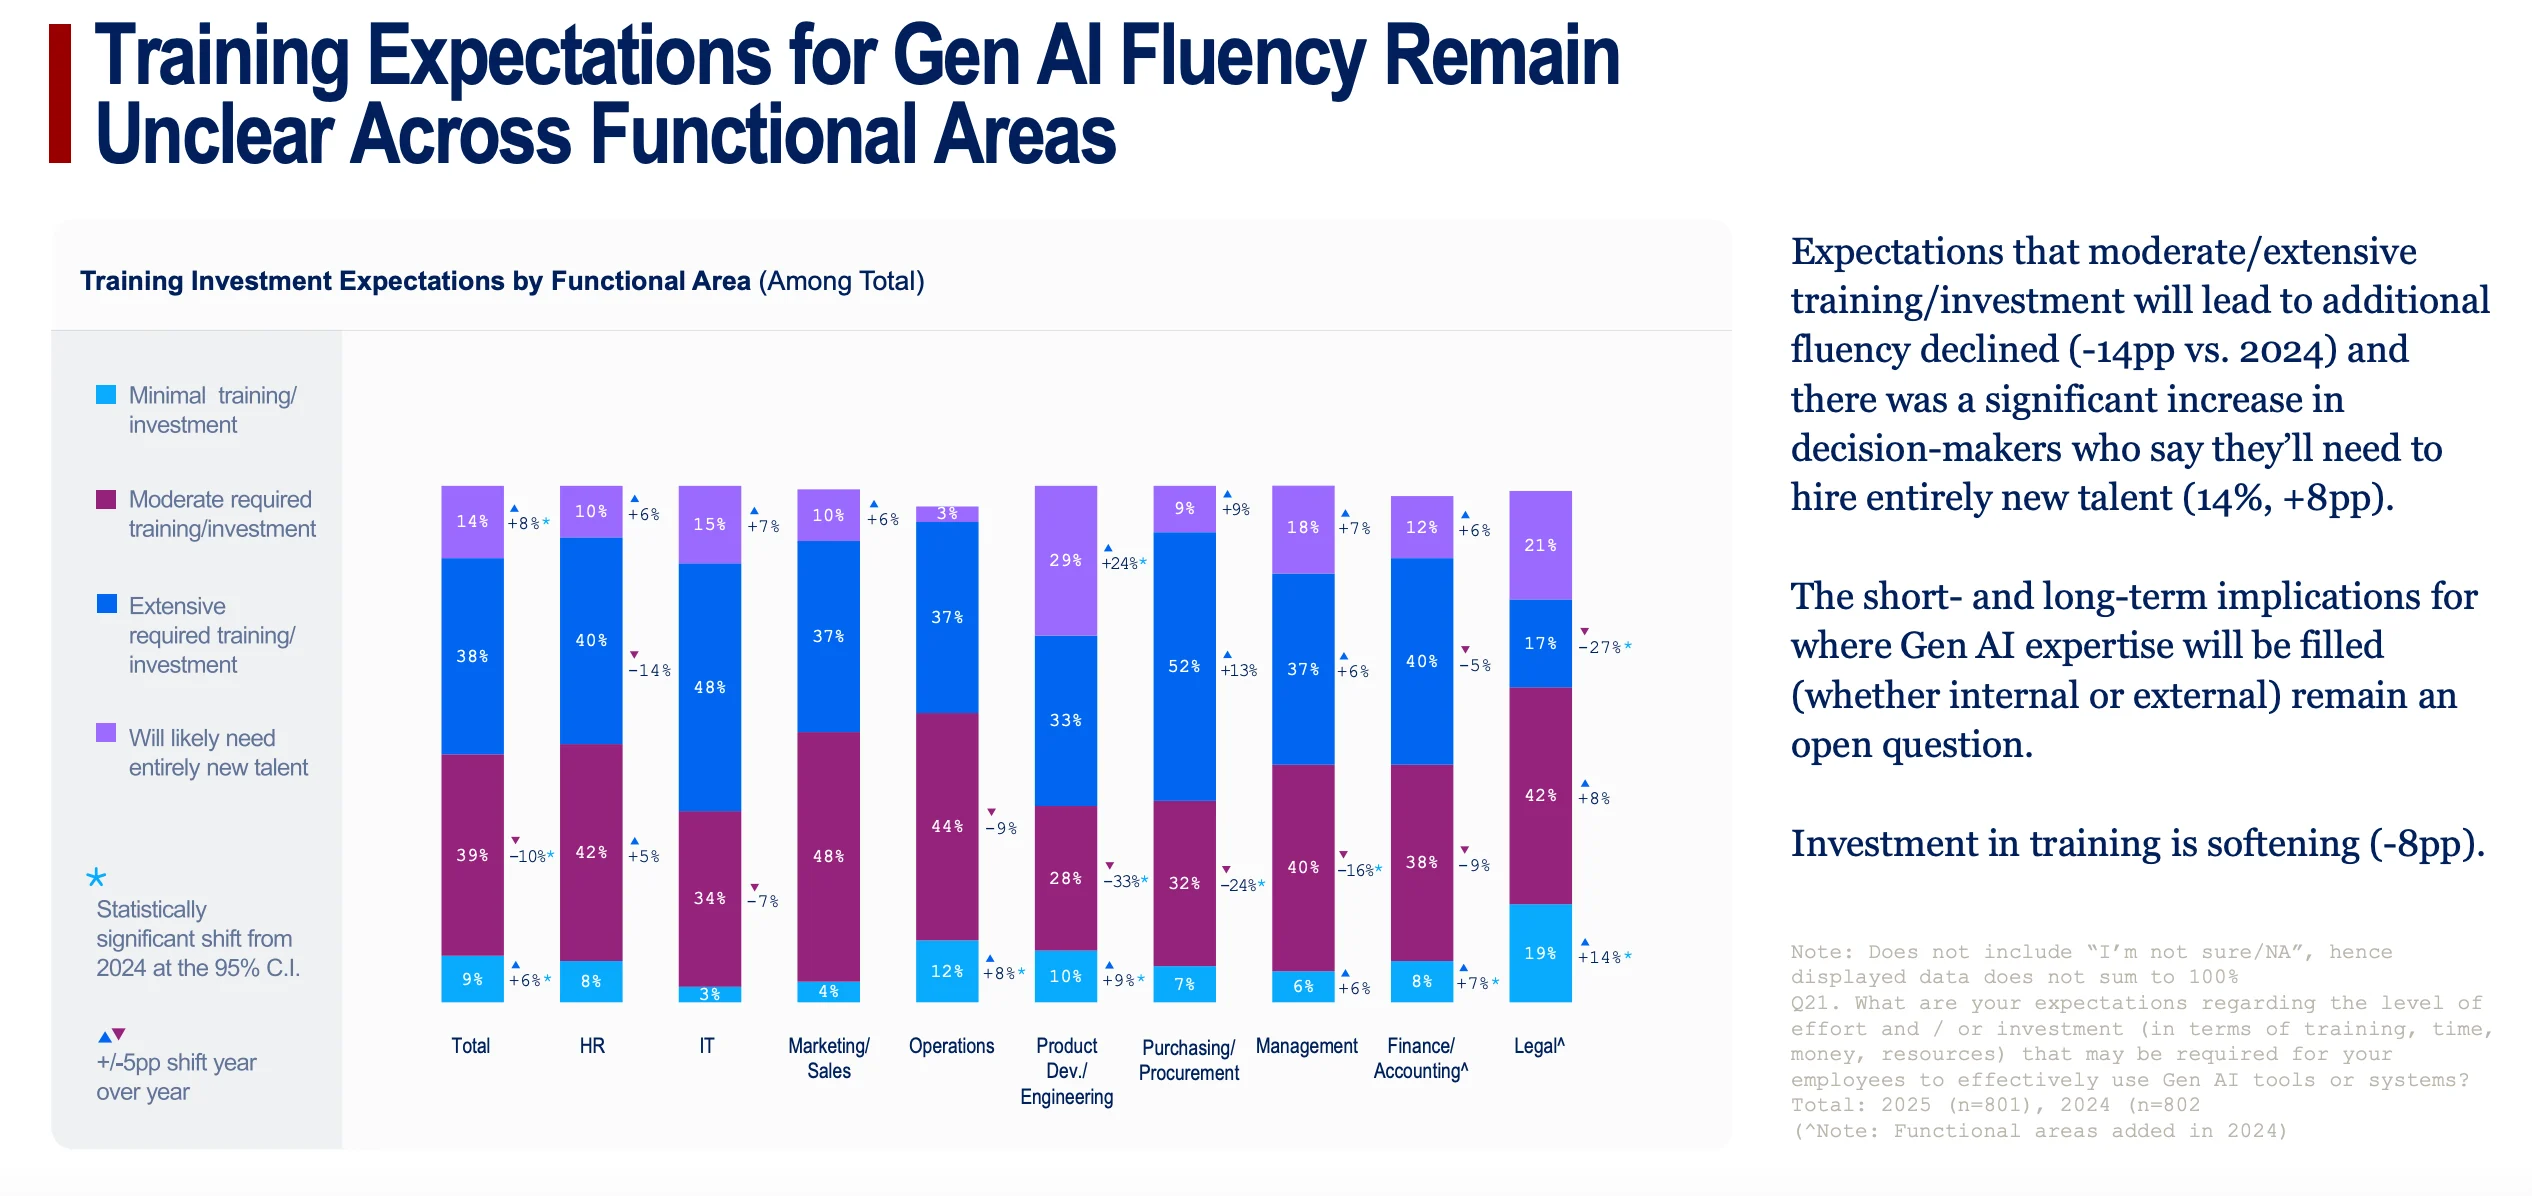
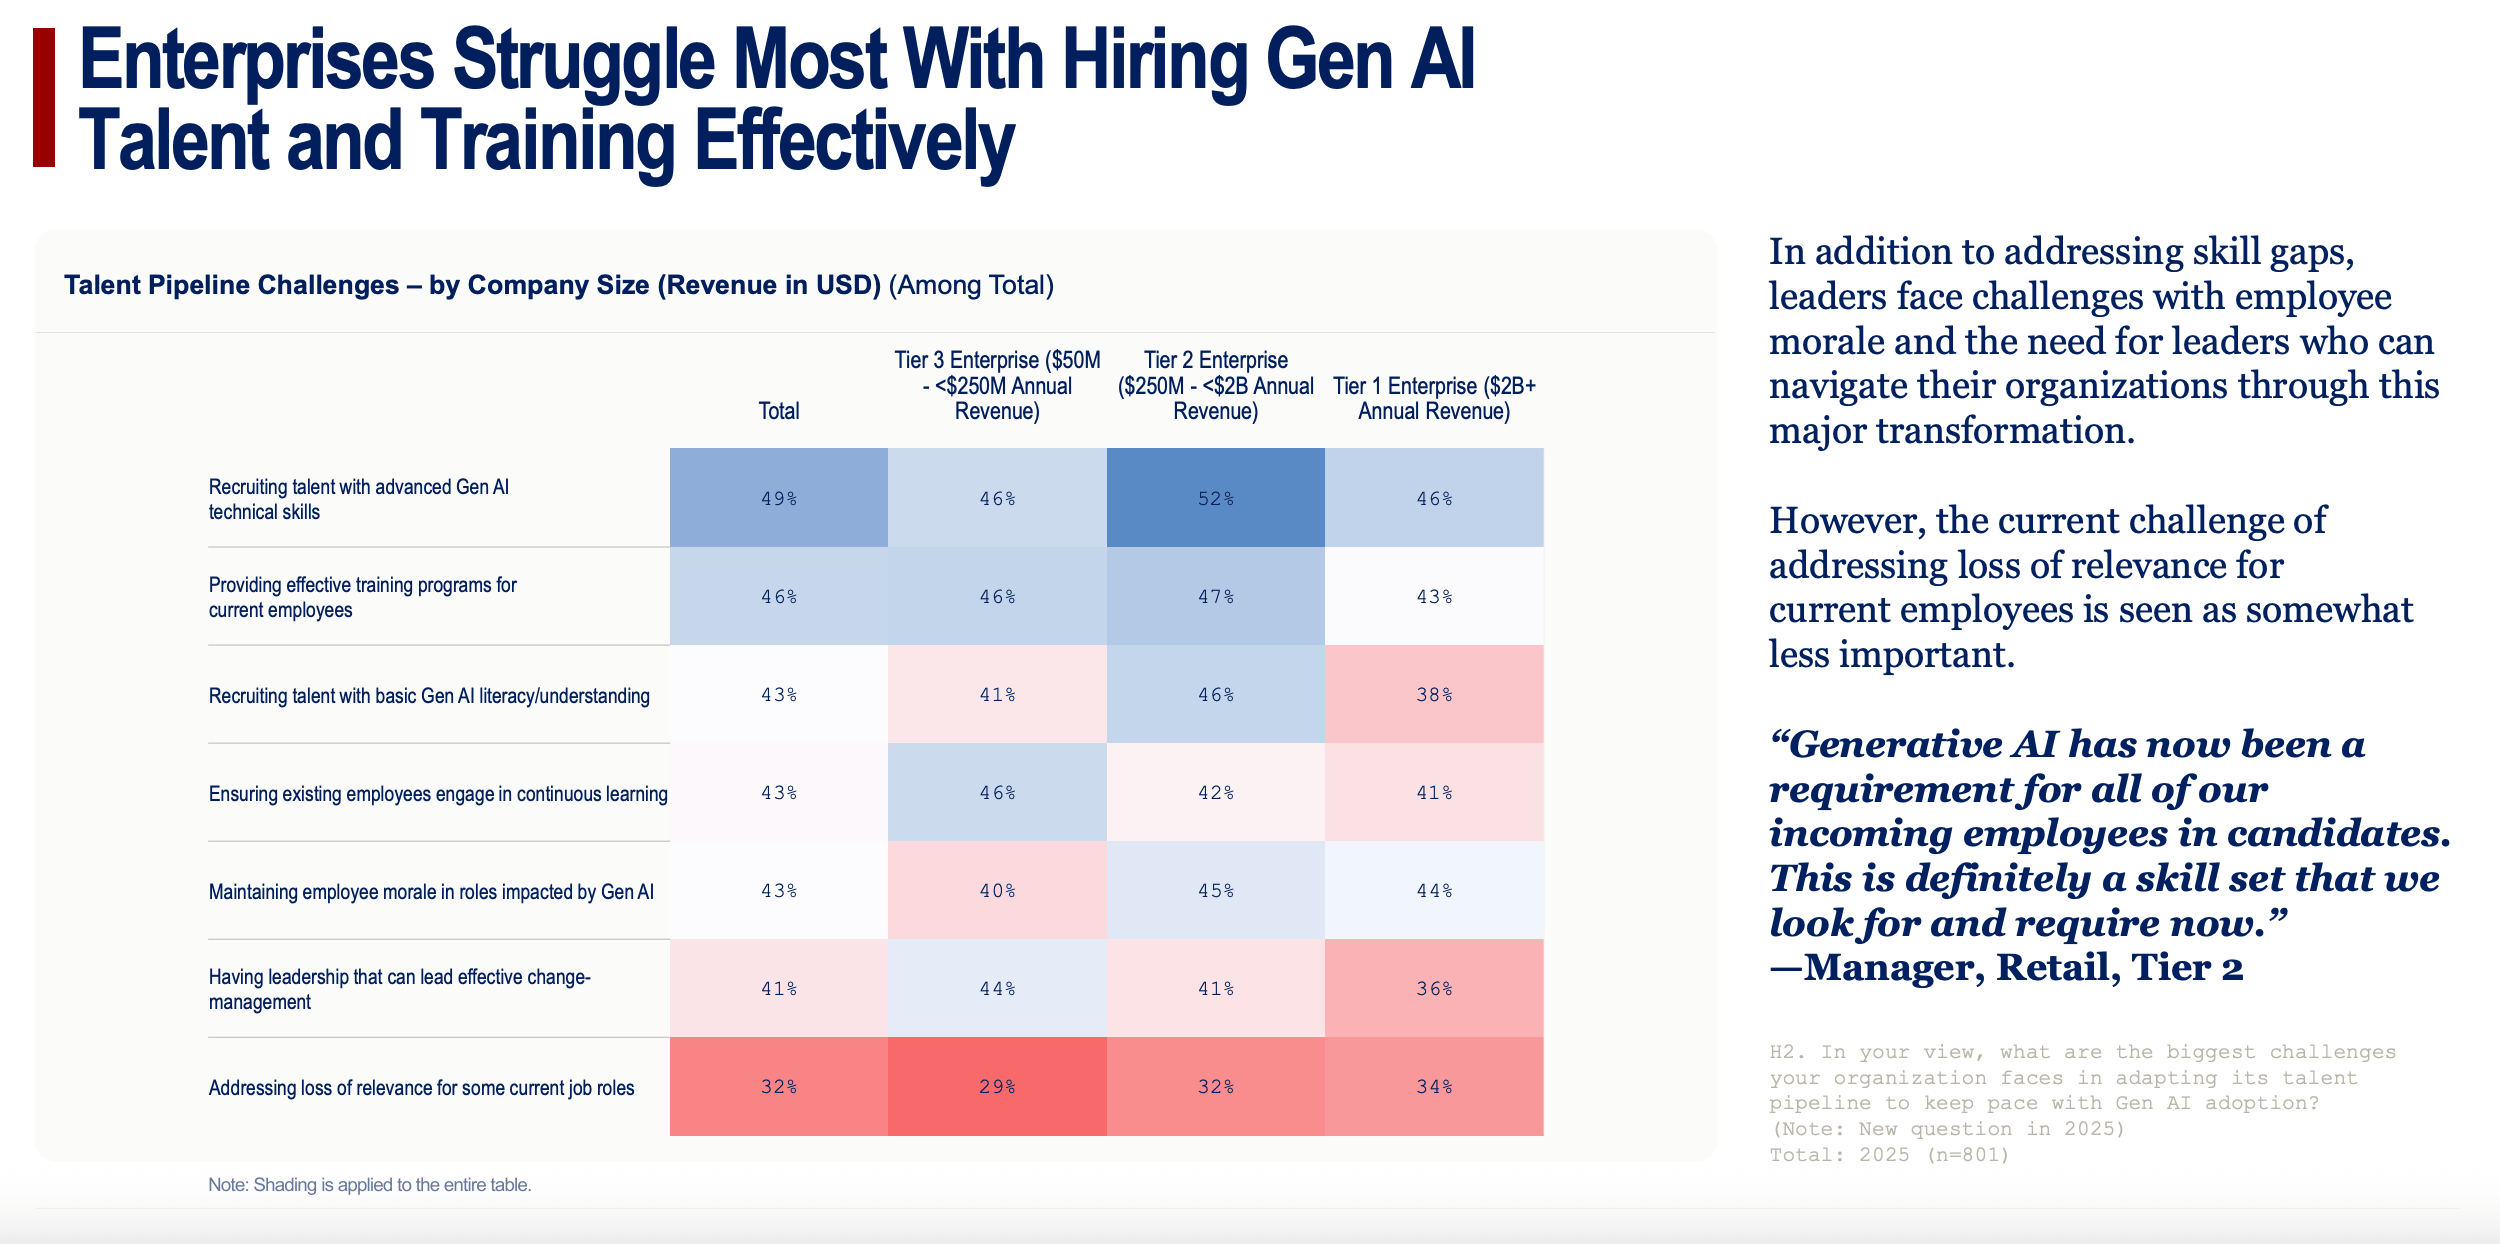
This concern is amplified by a faltering approach to talent development. Confidence that traditional training programs can create AI fluency has plummeted by 14 points from last year, while overall investment in training has softened. Consequently, the biggest challenges facing organizations are now recruiting talent with advanced Gen AI technical skills (cited by 49% of leaders) and providing effective training programs for current employees (46%).
This leads to a deeply uncertain future for hiring. Senior leaders are profoundly split on AI's net effect on jobs, but the data shows a disproportionate and complex impact on junior roles. For interns, while 17% of executives expect to hire fewer, a far larger cohort of 49% expect to hire more. This suggests that while AI may be automating some entry-level tasks, it is simultaneously creating new needs and roles at the bottom of the corporate ladder, fundamentally reshaping career paths from day one.
Ultimately, the report concludes that human factors—morale, change management, and cross-functional coordination—are the most persistent barriers to success. Without a deliberate strategy for role redesign, continuous learning, and fostering a culture of trust, the immense potential of generative AI will remain capped.
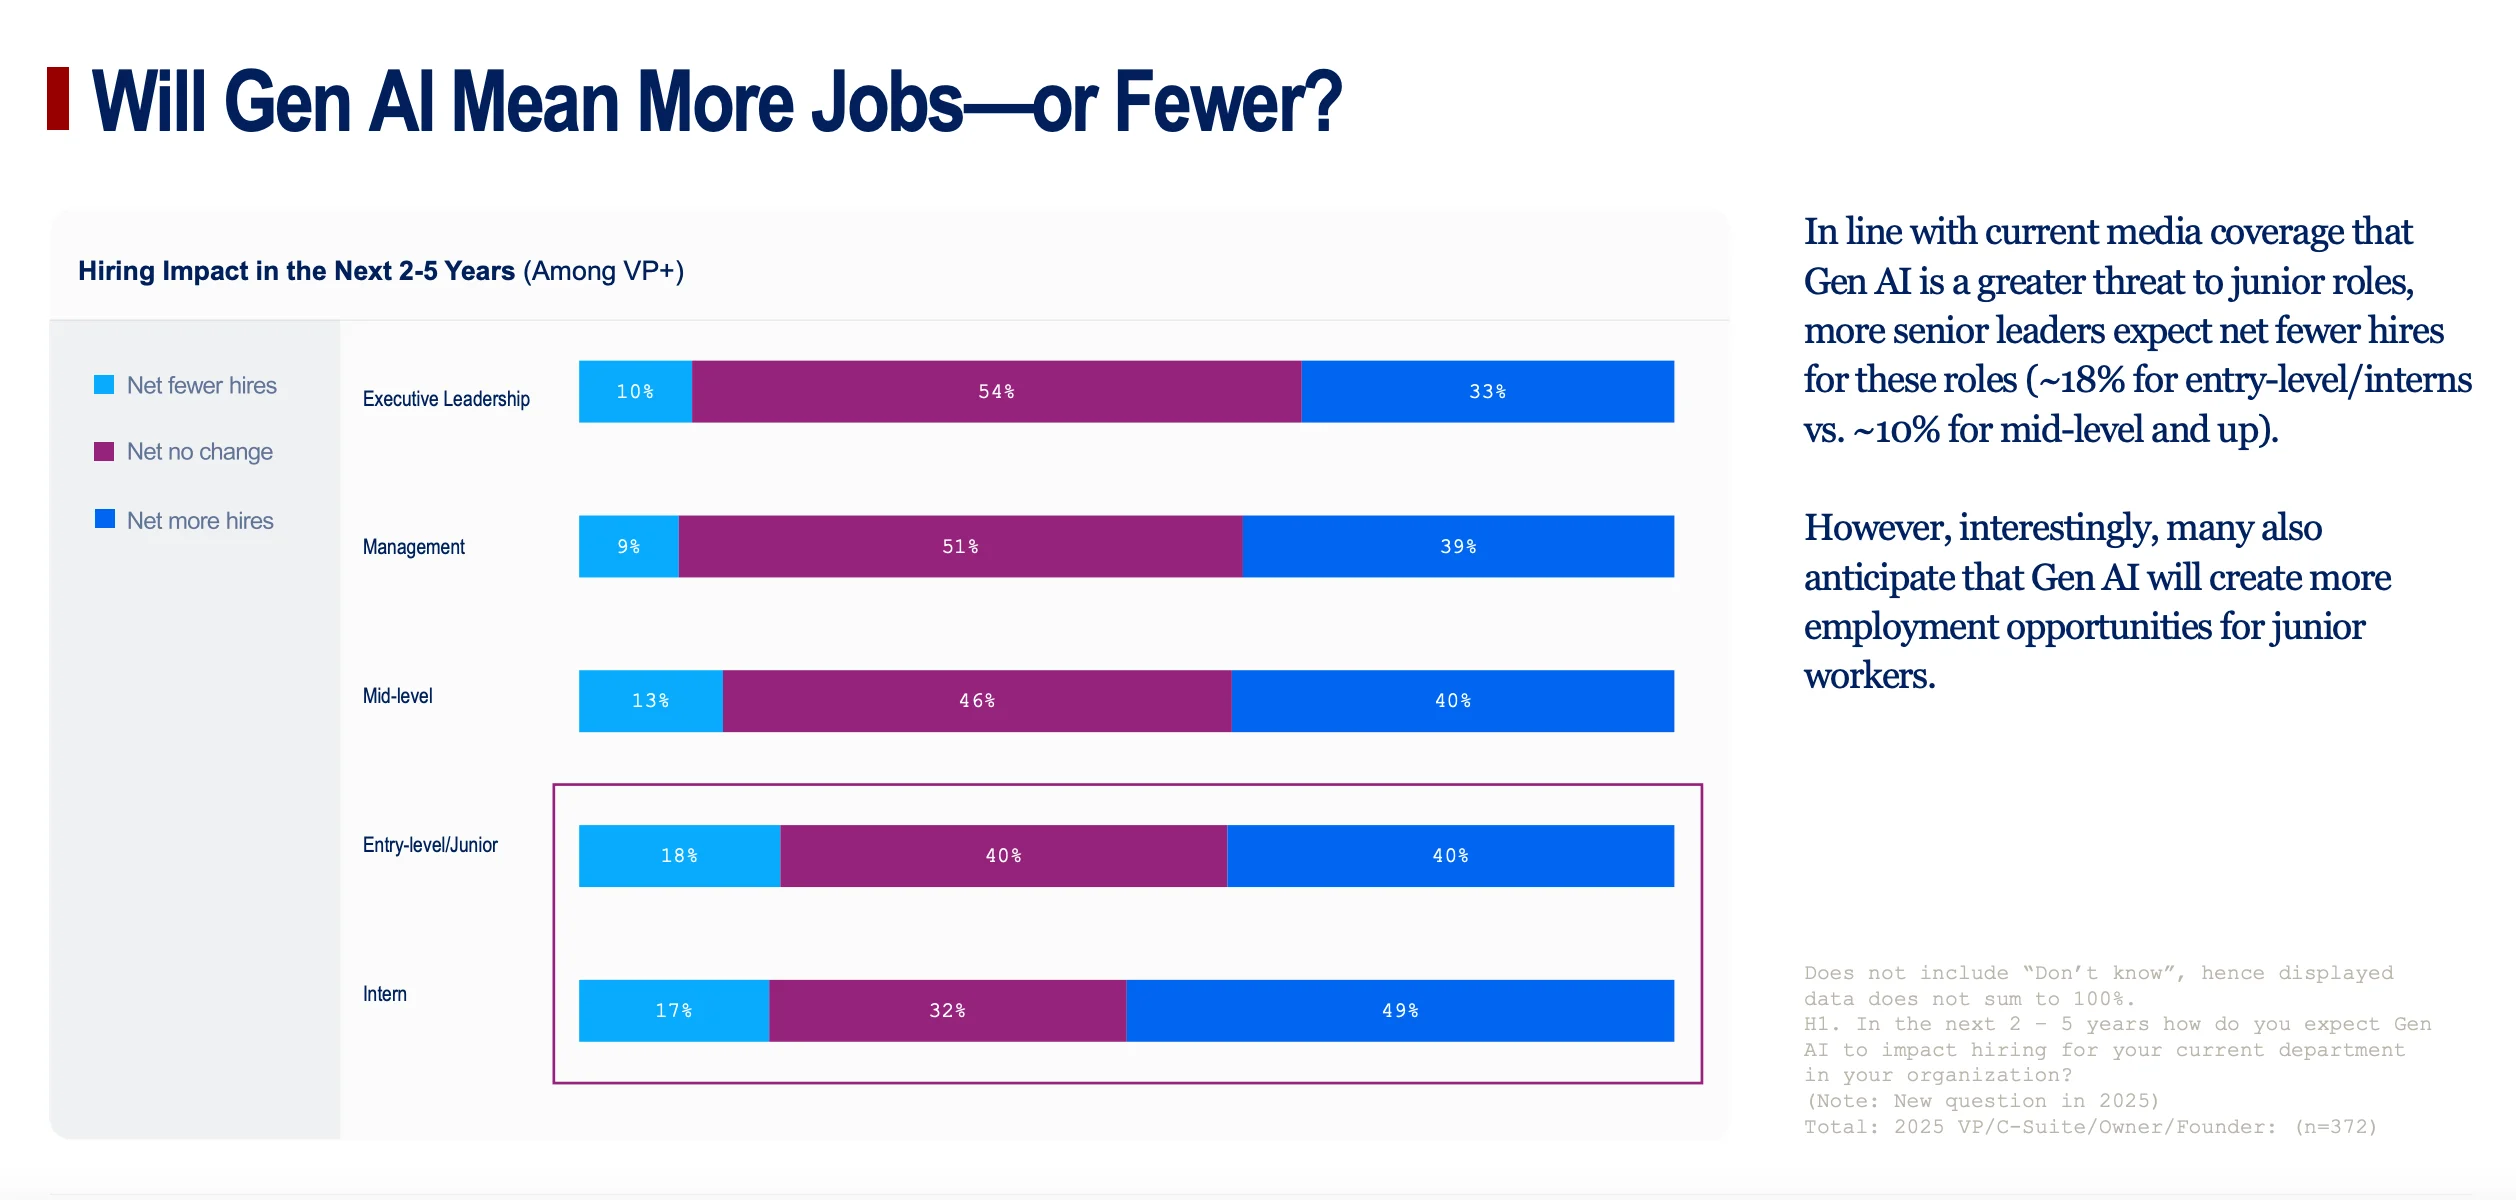
Chart-by-Chart Context
Here are the charts that caught our eye and why they are important
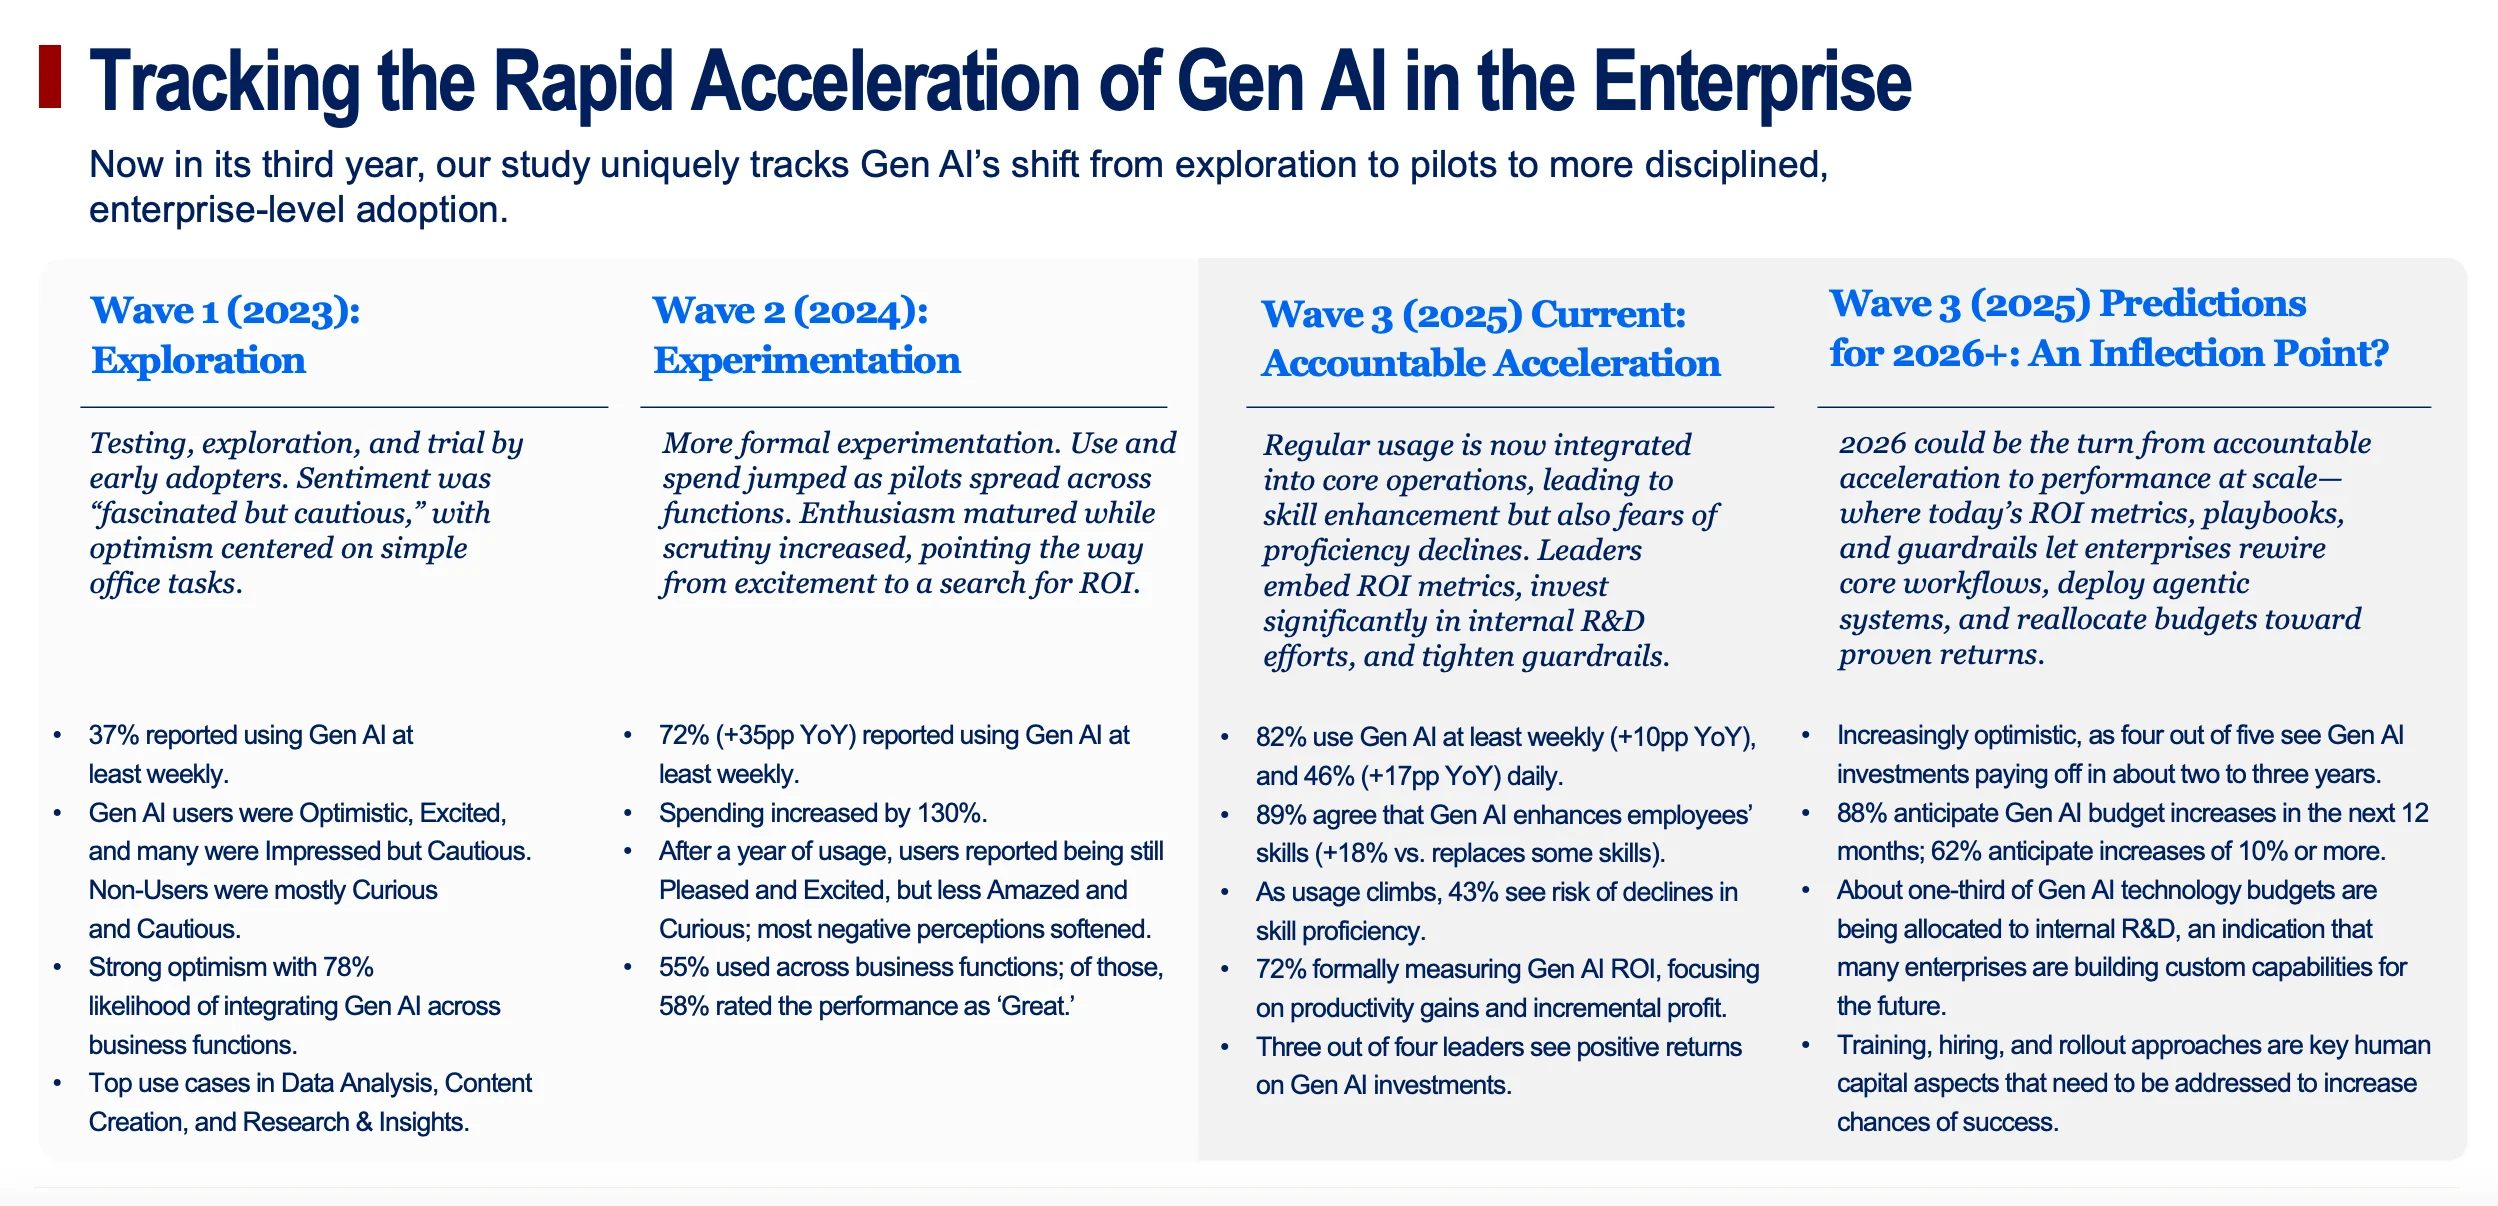
Chart 1: "Tracking the Rapid Acceleration of Gen AI in the Enterprise"
- What it shows: This chart is the entire three-year story of enterprise AI adoption at a glance. It visually tracks the evolution from Wave 1 (2023: Exploration), where companies were "fascinated but cautious," to Wave 2 (2024: Experimentation), where usage and spending jumped, to Wave 3 (2025: Accountable Acceleration), where usage is now a daily habit and ROI is a primary focus.
- Why it matters for the story: This is your opening scene. It establishes the incredible speed of change. The key takeaway is how quickly Gen AI went from a novelty to a core, measured business function. Use the stats on weekly usage (37% → 72% → 82%) to anchor the narrative of rapid acceleration.
Chart 2: "Proving Value: Measuring Investment, Impact & ROI"
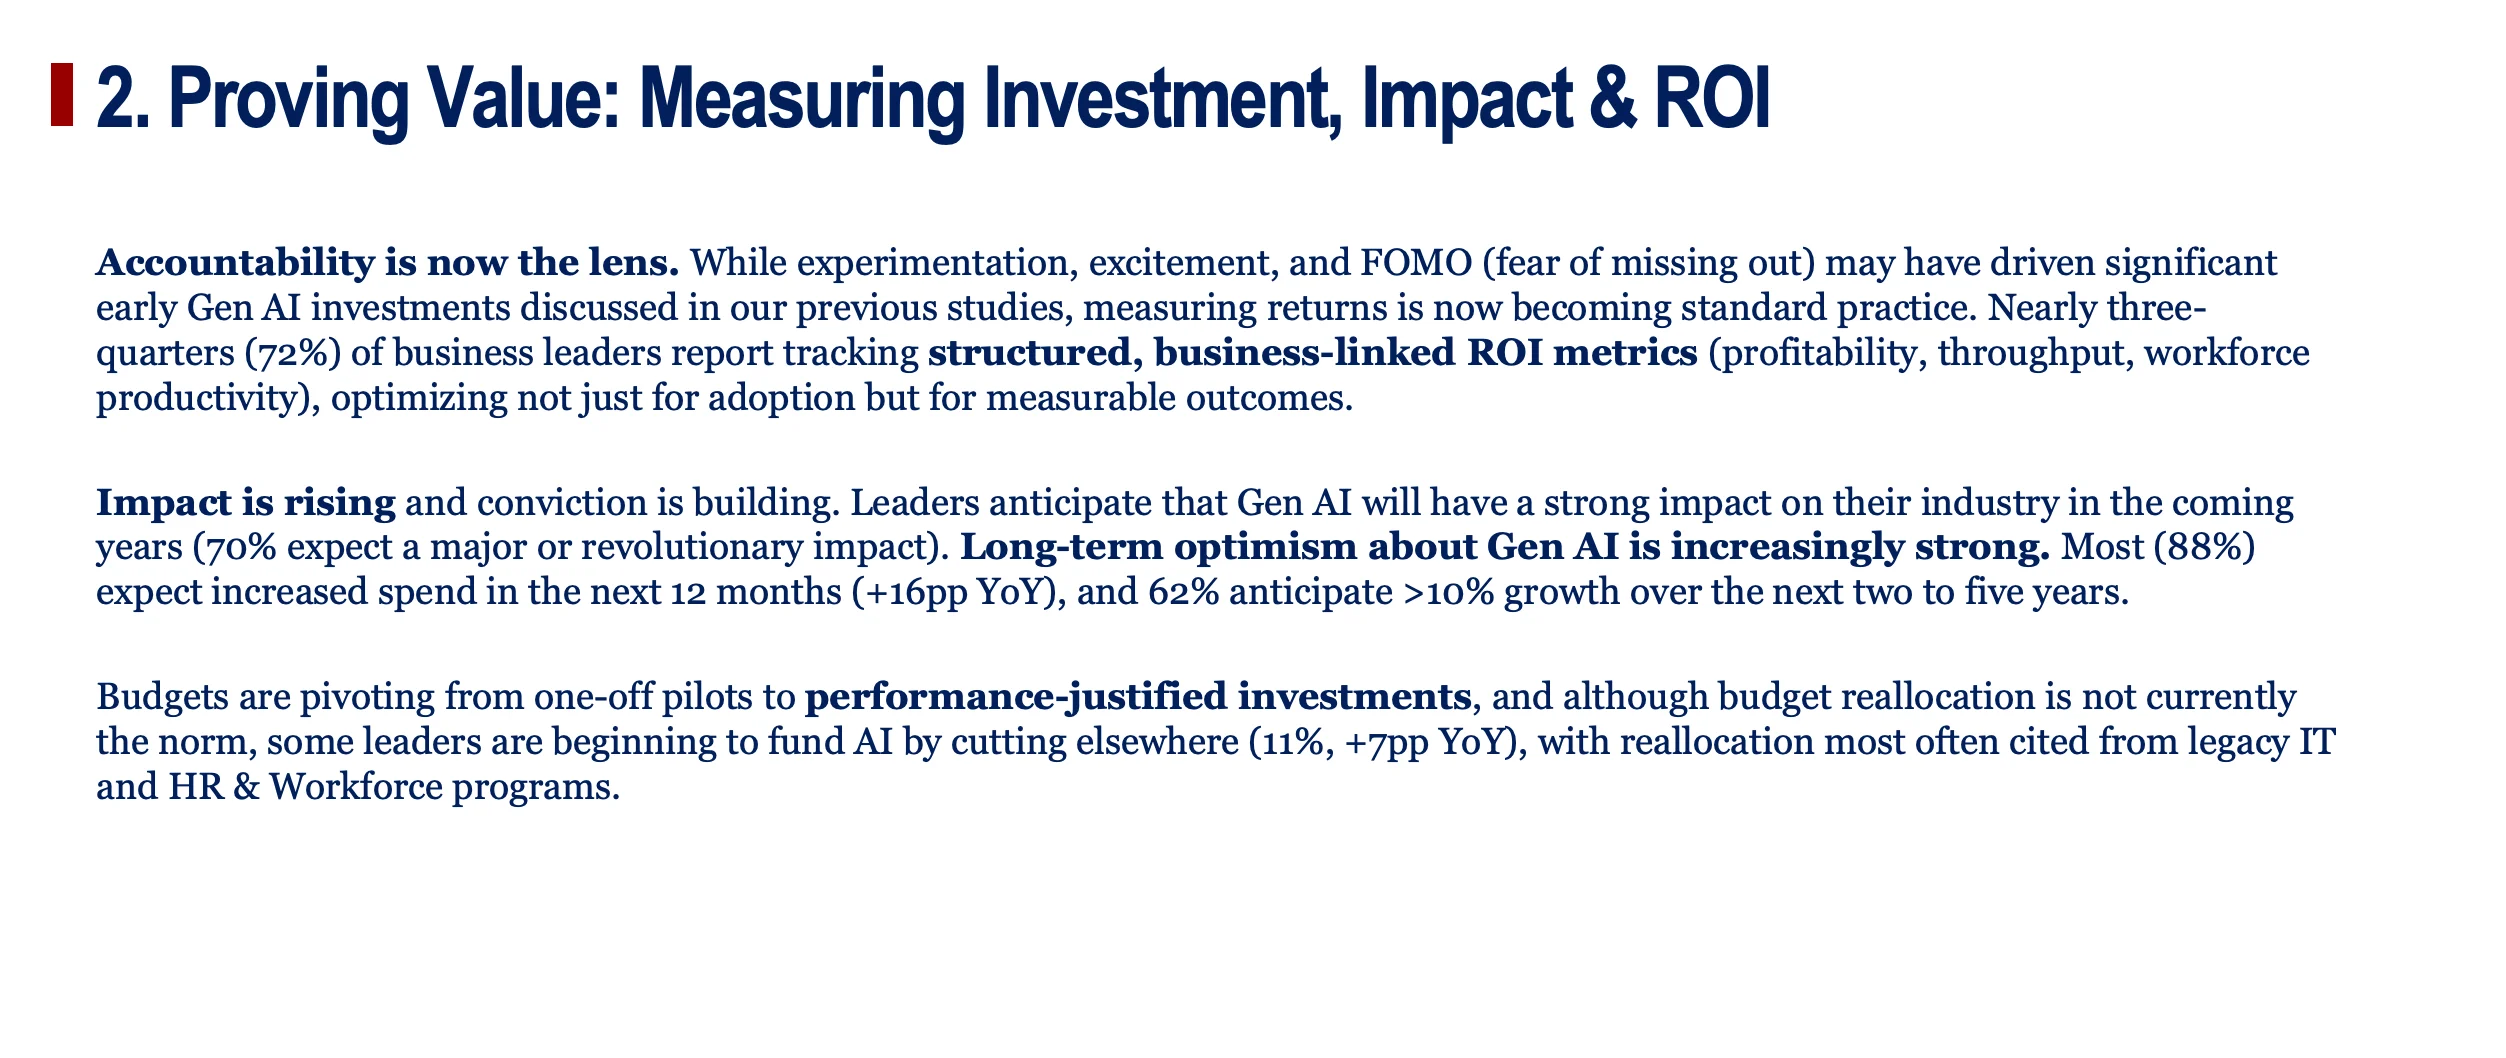
- What it shows: This is a text-based summary of the report's central theme. It highlights that "Accountability is now the lens." The most critical facts are that 72% of firms are tracking structured ROI, 88% expect to increase spending, and budgets are shifting from experimental pilots to "performance-justified investments."
- Why it matters for the story: This slide defines the current era of enterprise AI. The story is no longer about potential; it's about proof. It's the shift from "what can this do?" to "what is this doing for our bottom line?" This is the core evidence that the "honeymoon phase" is over.
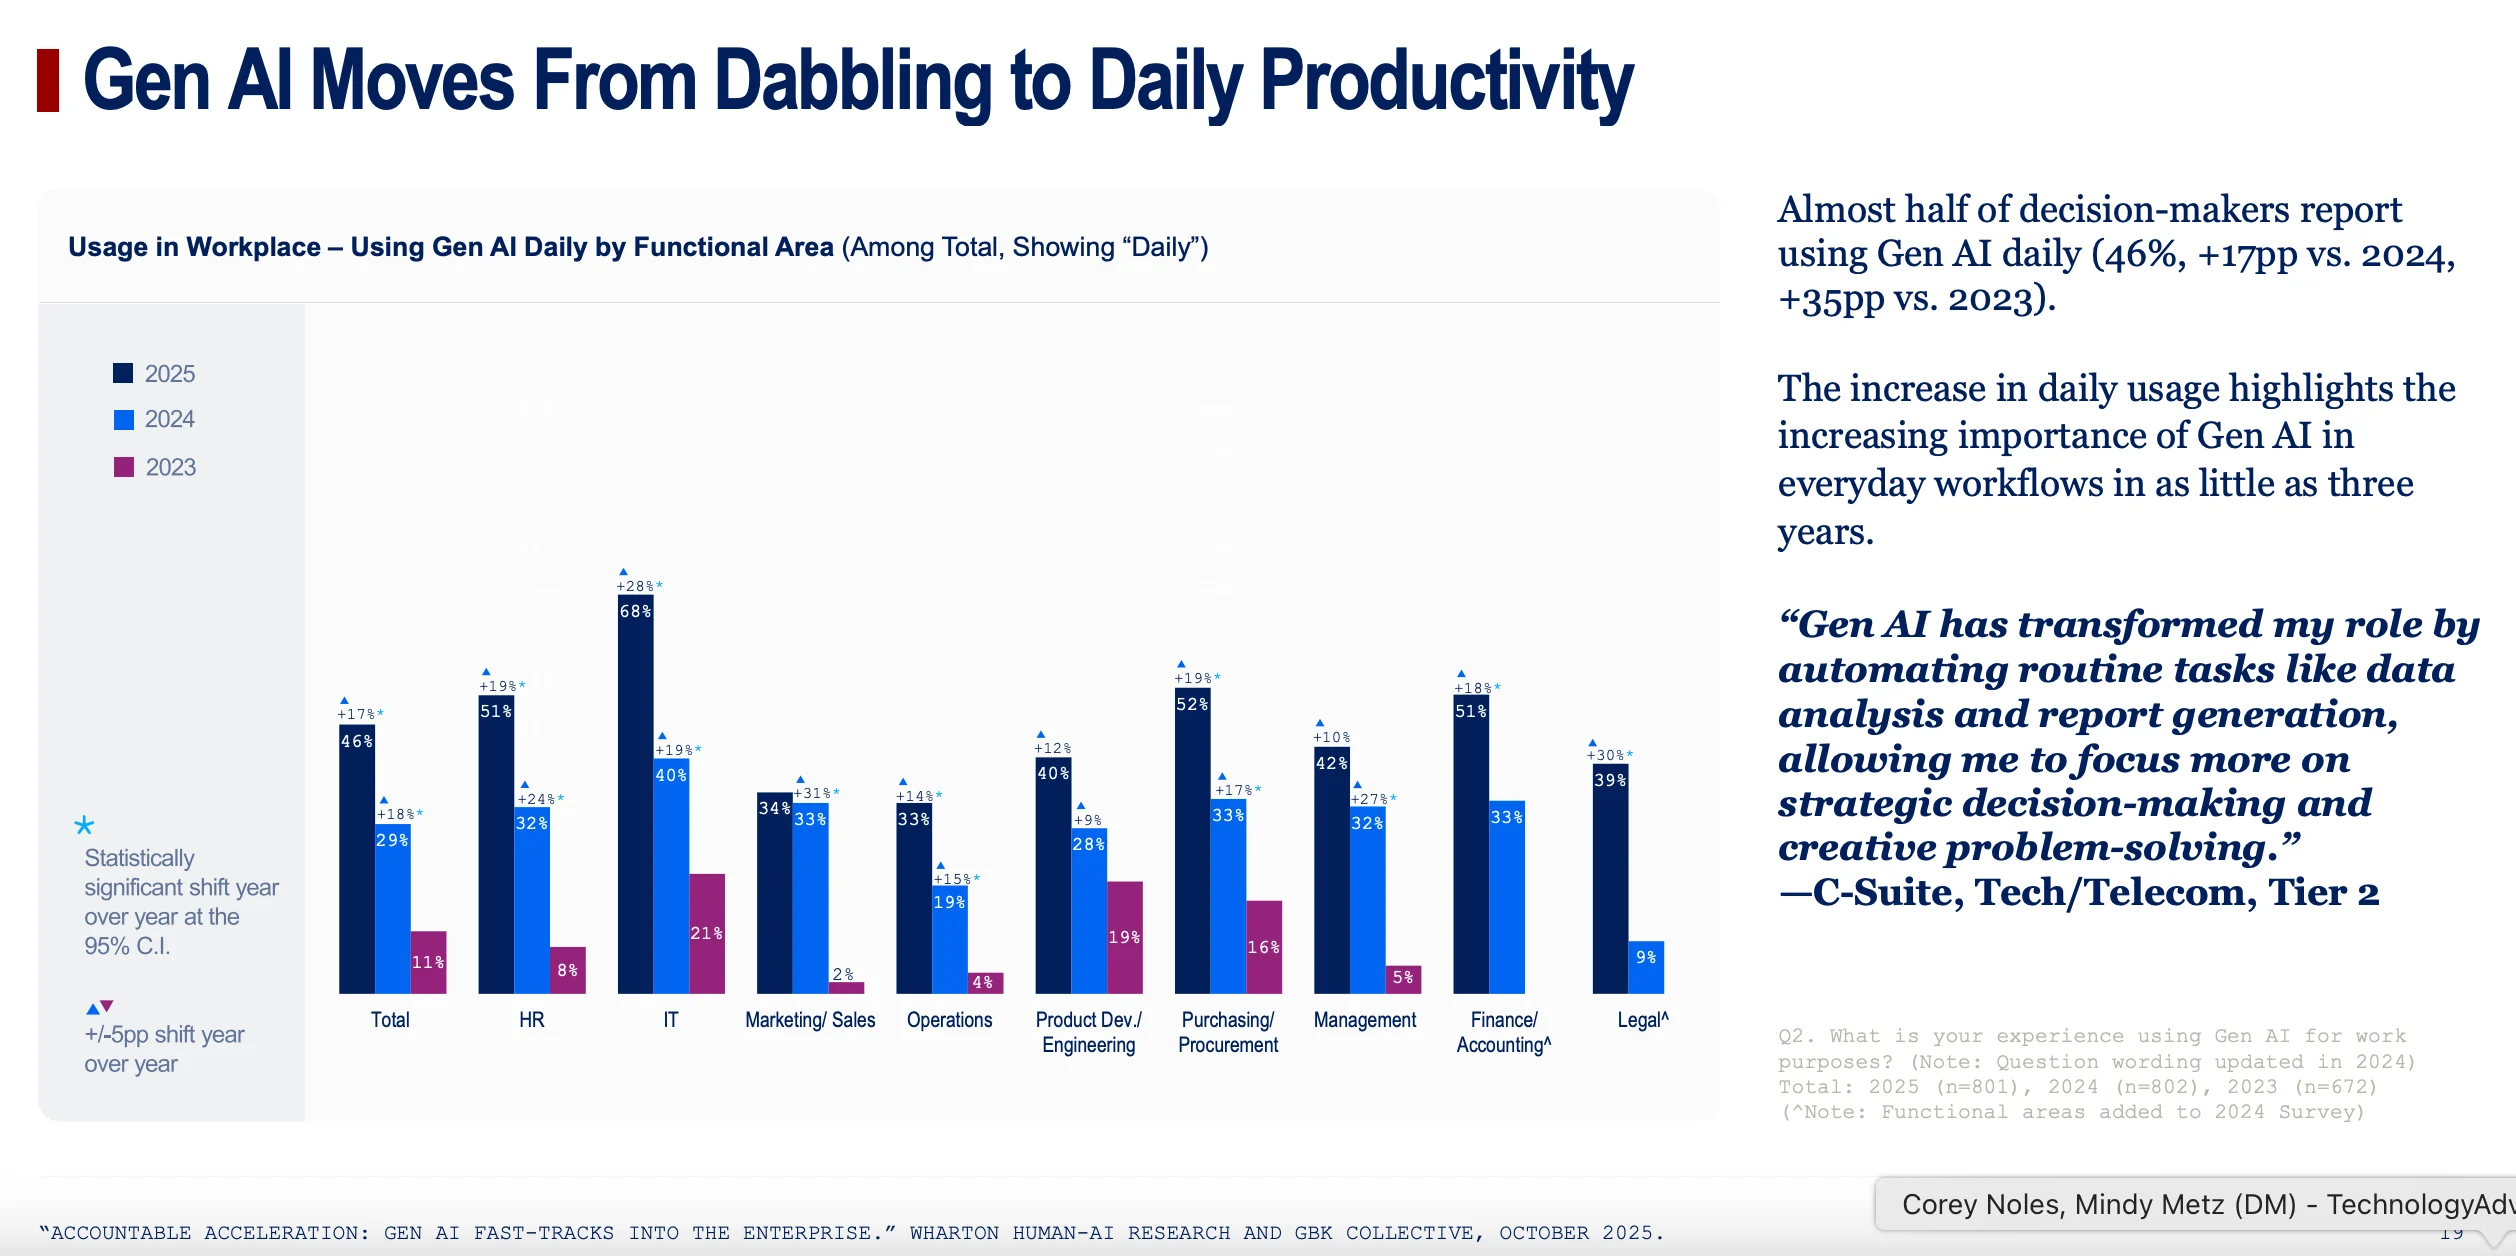
Chart 3: "Gen AI Moves From Dabbling to Daily Productivity"
- What it shows: This bar chart provides the single best data point for AI becoming mainstream: 46% of business leaders now use Gen AI daily, a massive jump from just 29% last year and 11% in 2023. The accompanying quote perfectly illustrates the benefit: automating routine work to focus on strategic decisions.
- Why it matters for the story: This makes the adoption story tangible. AI isn't just a tool you check once a week; for nearly half of decision-makers, it's as integrated into the workday as email or Slack. It's the proof that AI has become a daily habit.
Chart 4: "Enterprise Leaders Confident in Future ROI"
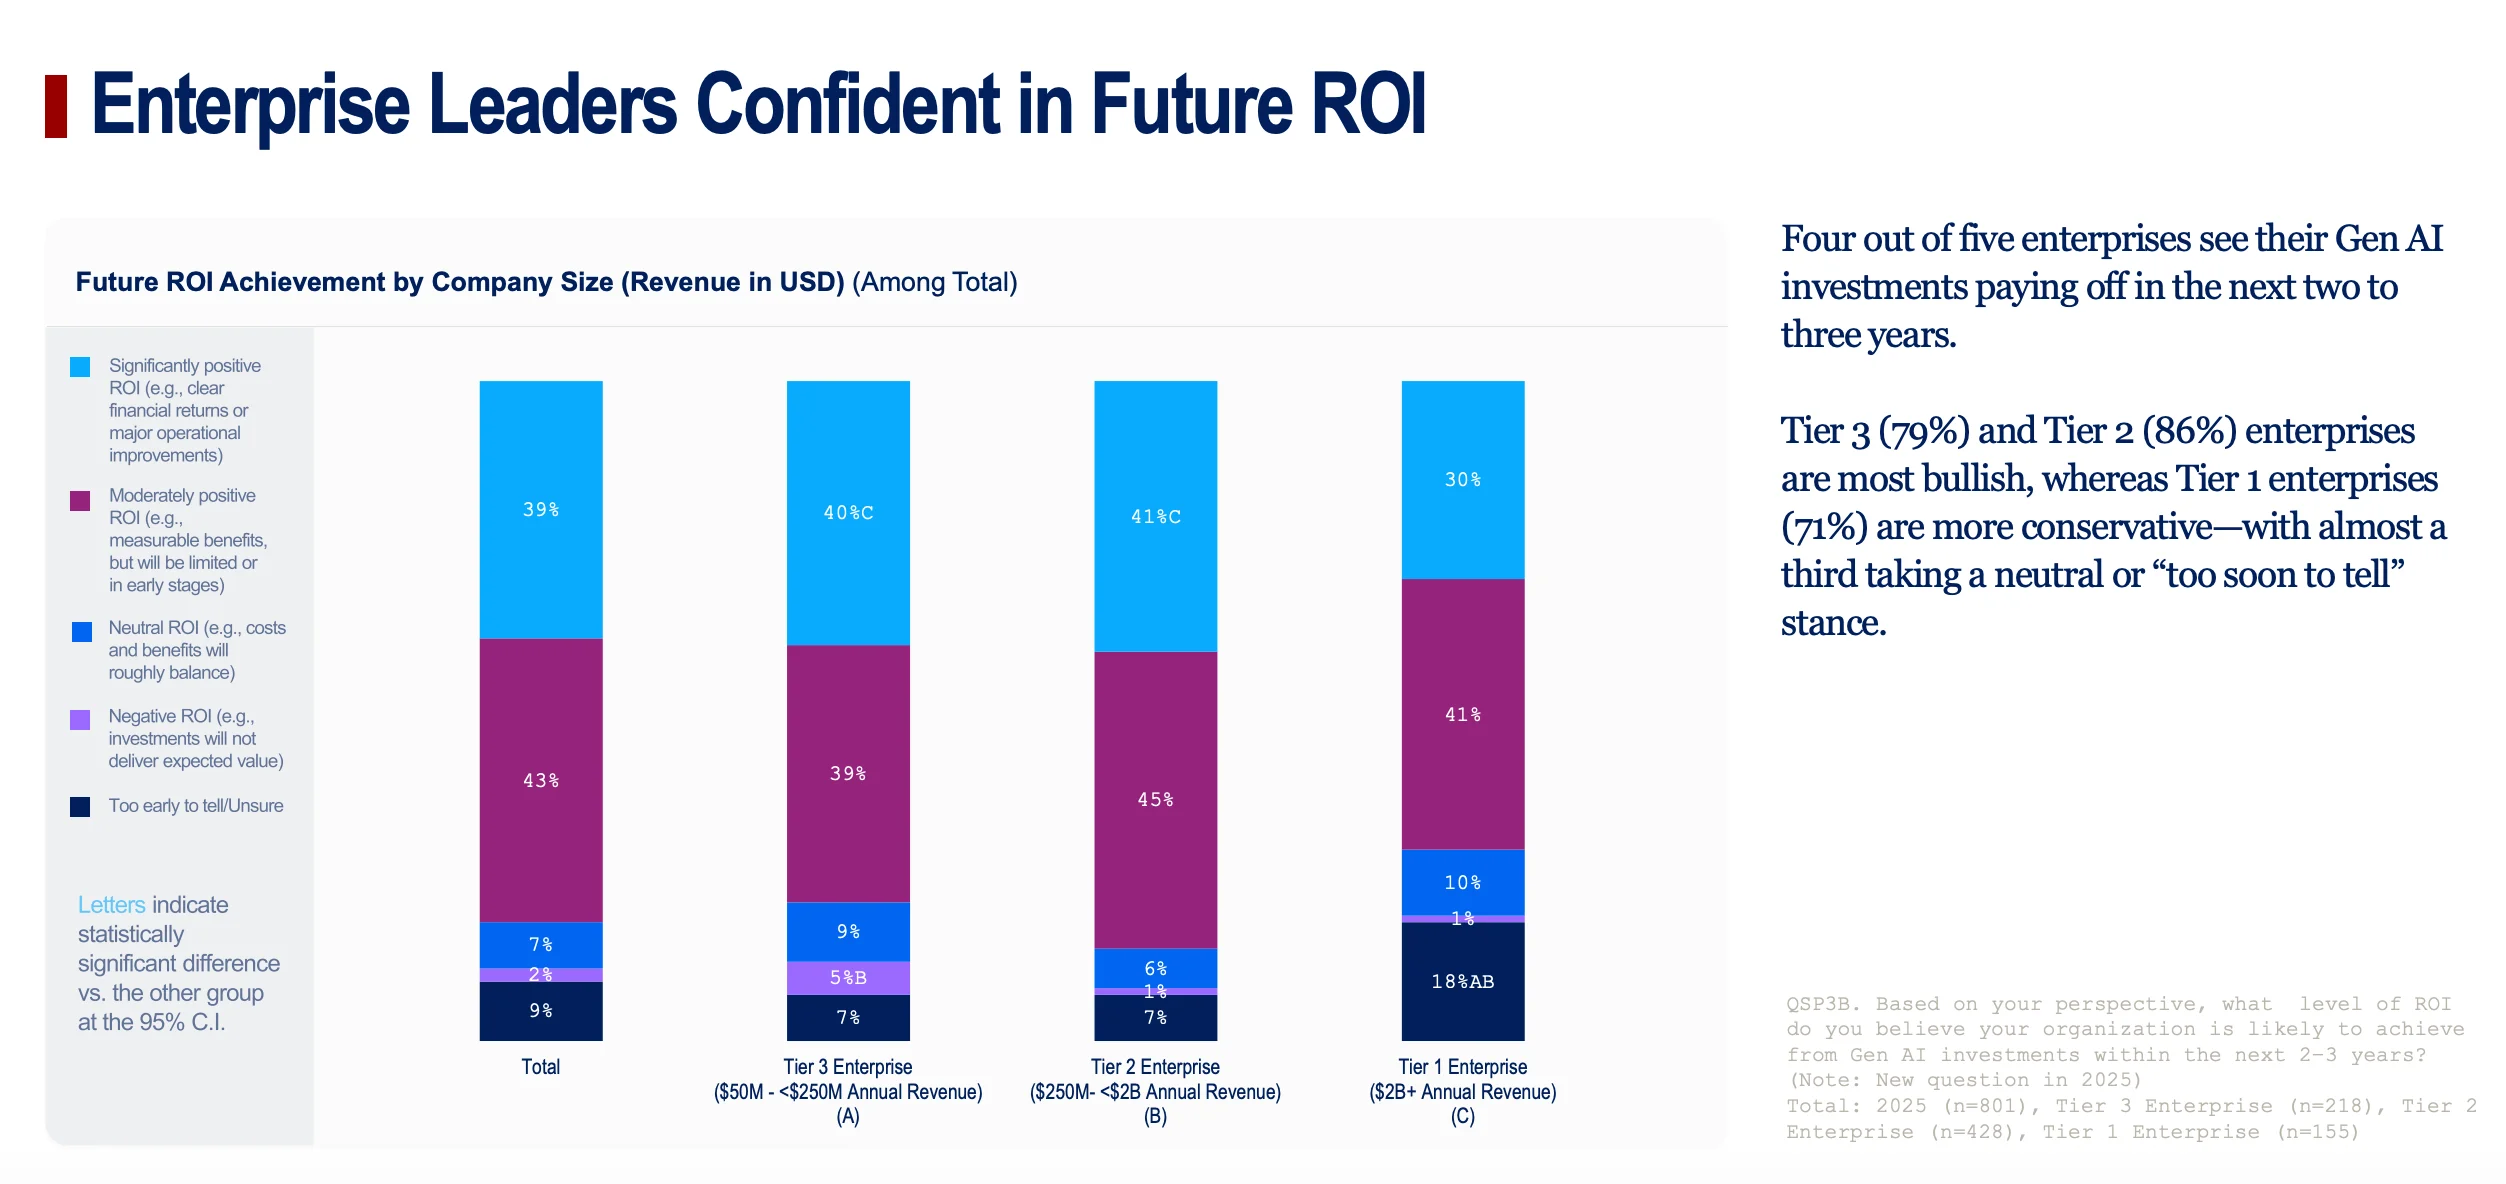
- What it shows: This chart looks ahead, showing that leaders have unshakable long-term confidence. Four out of five expect their Gen AI investments to pay off within the next two to three years. It also reveals a key nuance: Tier 1 (the largest) companies are more conservative, with a third saying it's "too soon to tell," while smaller, more agile companies are more bullish.
- Why it matters for the story: This demonstrates that current challenges aren't dampening long-term optimism. The nuance about company size tells a story of agility vs. complexity—smaller firms can pivot and see value faster, while corporate giants are navigating more complex integrations.
Chart 5: "Most Enterprises See Positive ROI—Faster in Digital, Slower in Physical Ops"
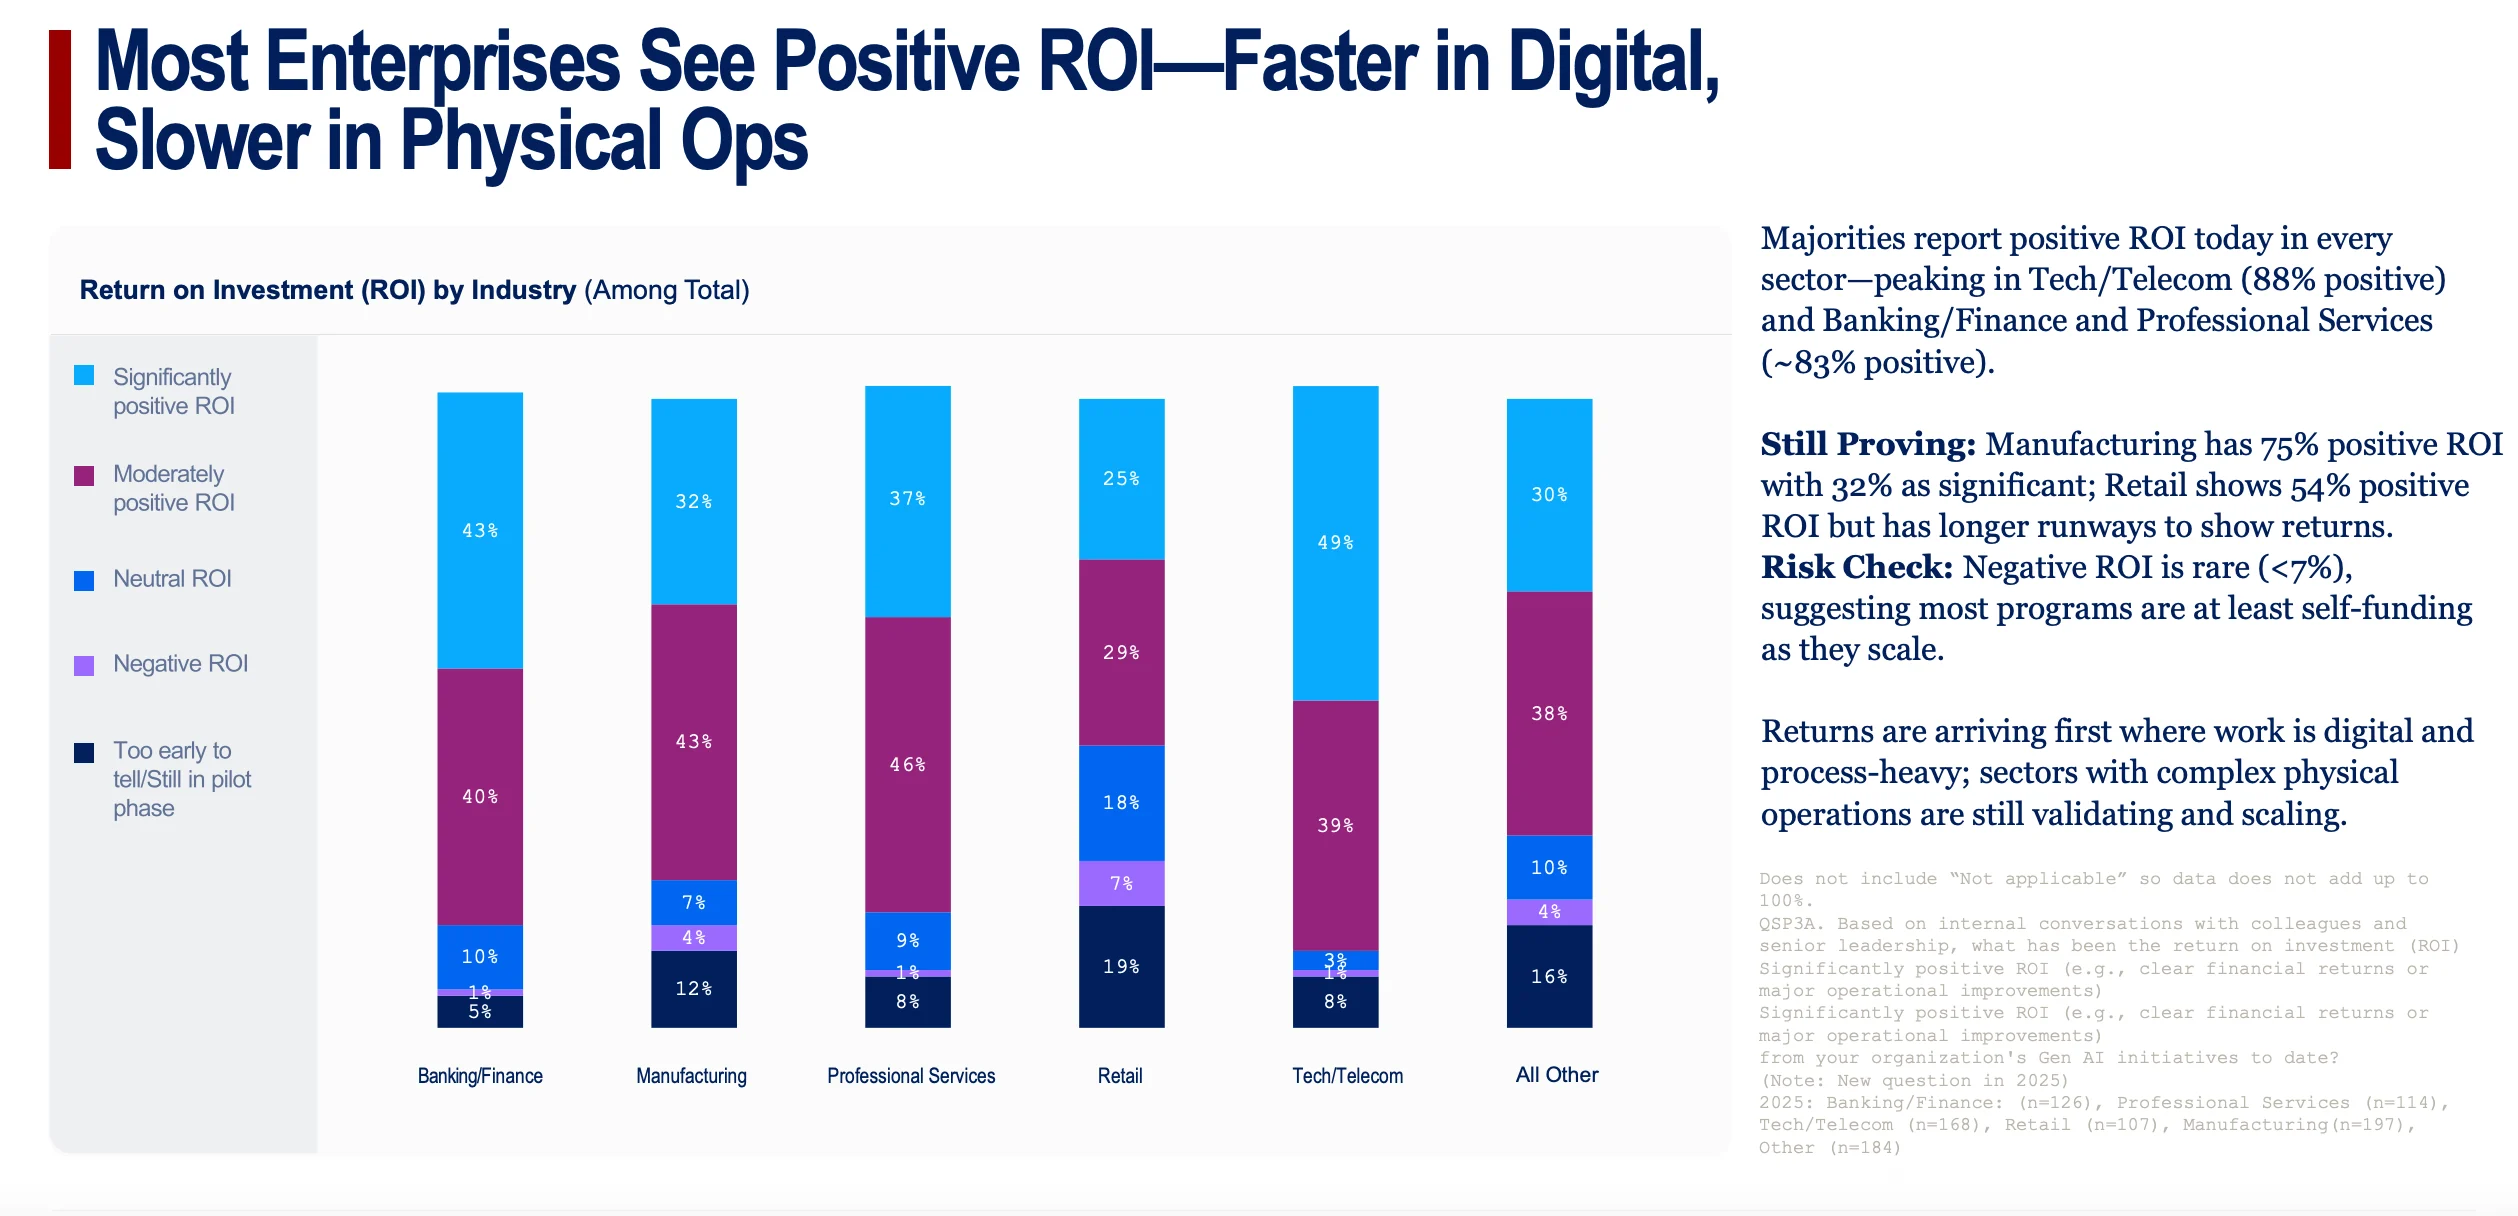
- What it shows: This chart breaks down current ROI by industry, revealing a stark divide. Digitally native sectors like Tech/Telecom (88% positive ROI) and Banking/Finance (83%) are seeing huge returns. In contrast, industries with complex physical operations like Retail (54%) and Manufacturing (75%) are finding it harder to realize value.
- Why it matters for the story: This is one of the most important charts. It explains where AI is winning and why. It's much easier to automate code and financial models than it is to optimize a factory floor or a physical supply chain. This is the evidence for the "tale of two industries."
Chart 6: "ROI Focus: Performance and Profit, With Some Functions Leading the Way"
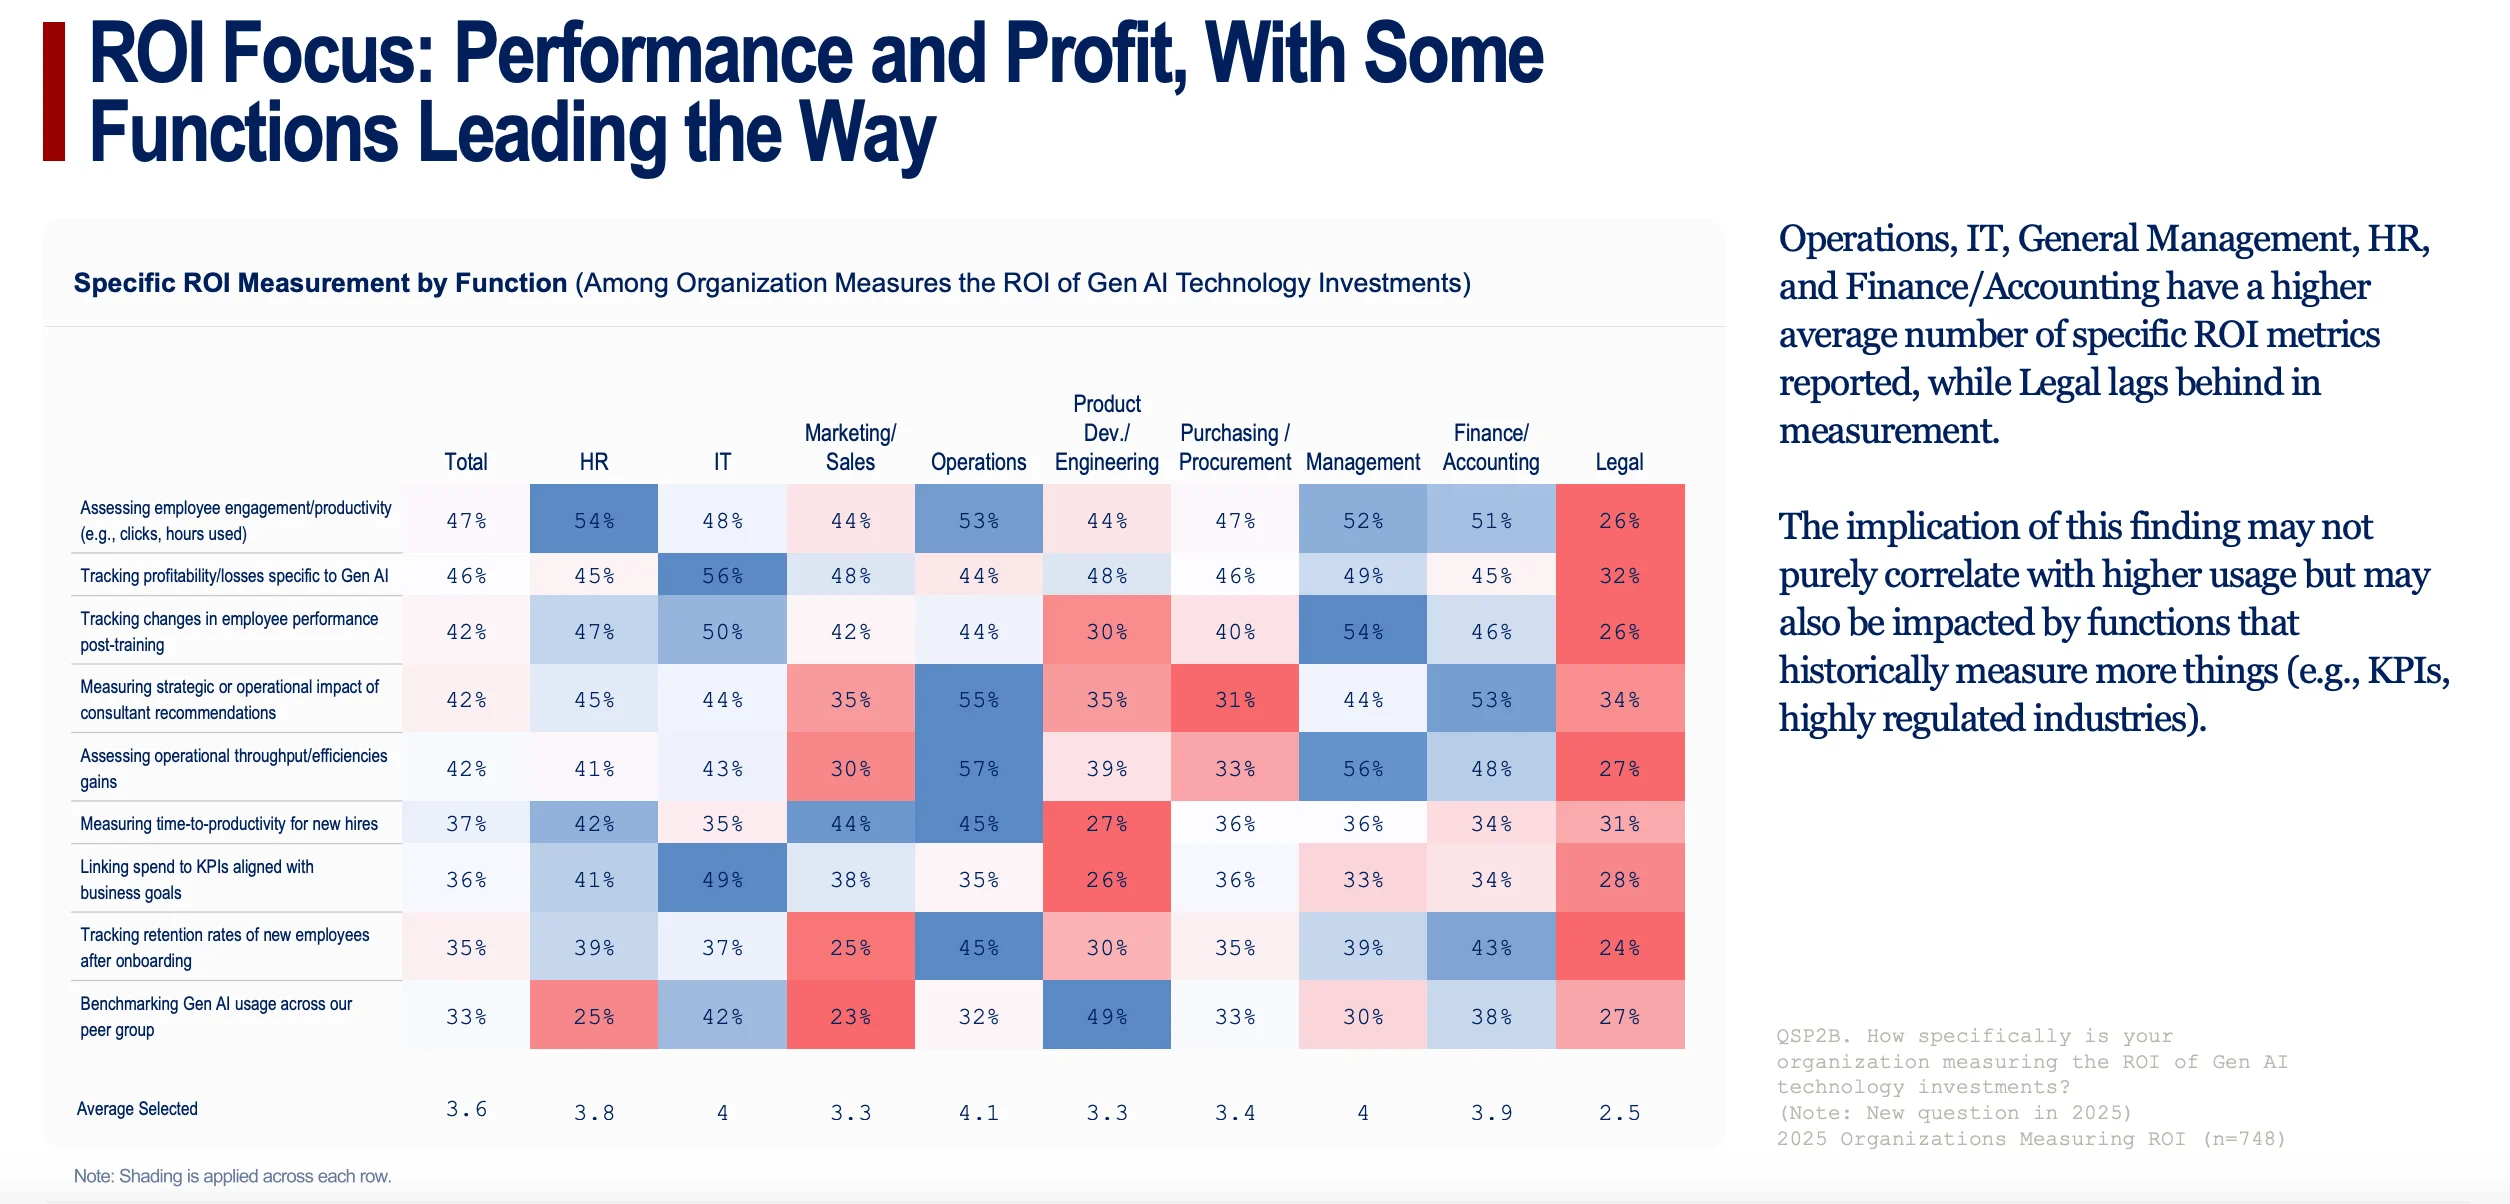
- What it shows: This heatmap details what companies are measuring to calculate ROI. The top metrics are employee productivity, profitability specific to AI, and changes in employee performance. It also shows that functions that are already data-heavy and highly regulated (like IT, Operations, and Finance) are leading the way in applying rigorous measurement to AI.
- Why it matters for the story: This adds credibility to the ROI claims by showing the specific, business-focused metrics being used. It’s not just about "usage," it’s about profit, efficiency, and performance.
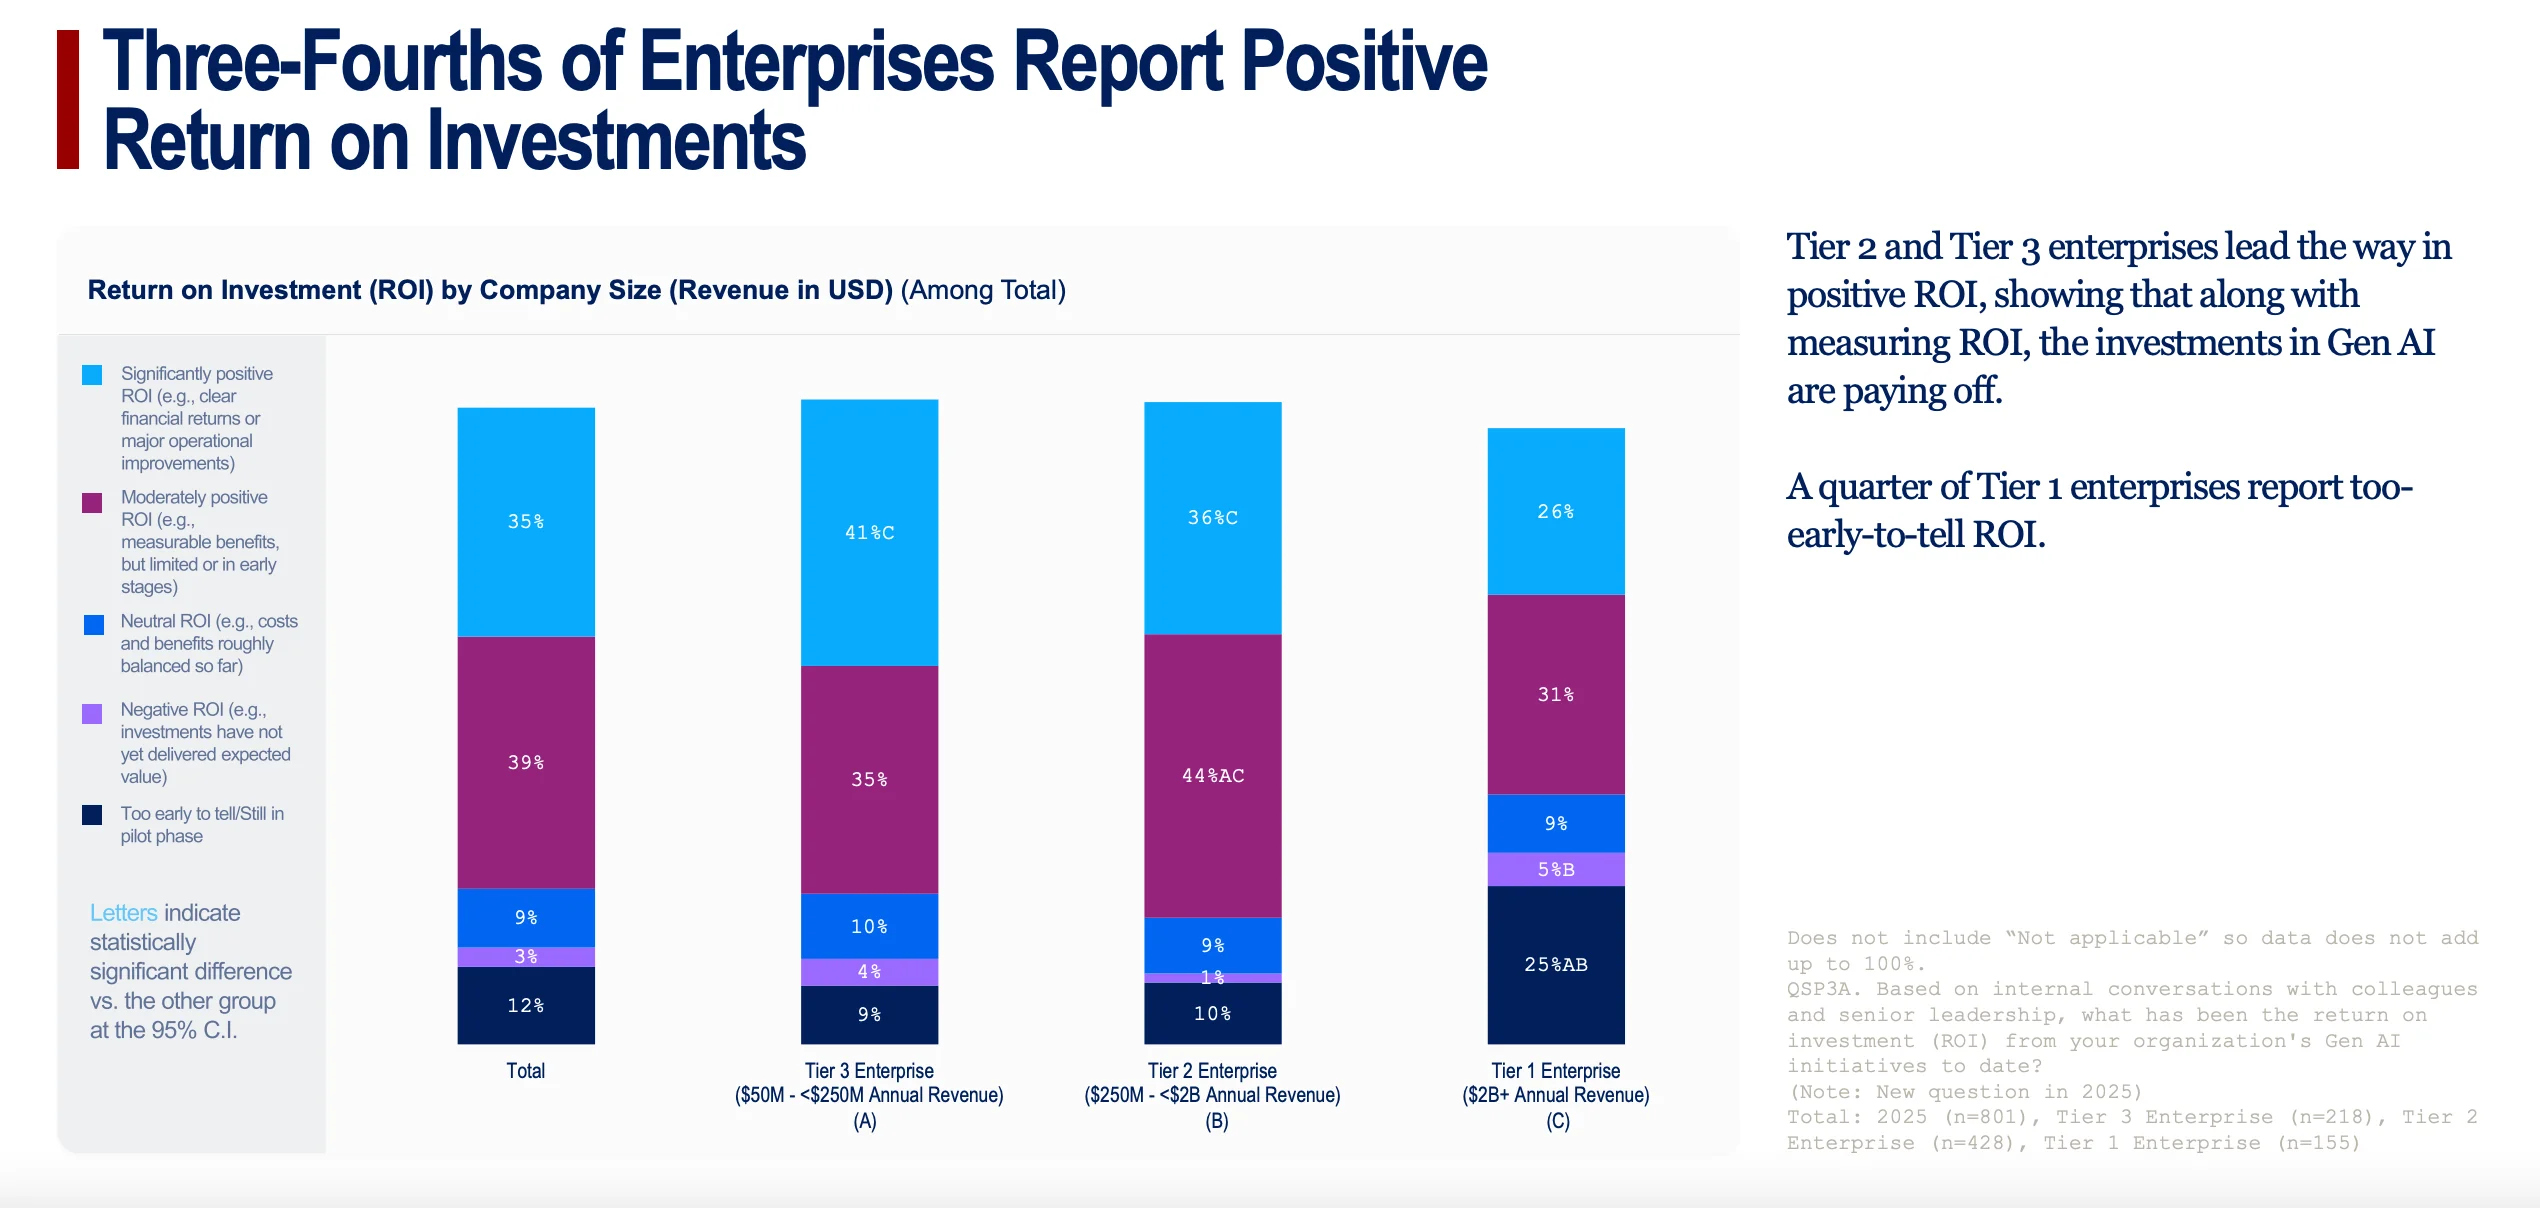
Chart 7: "Three-Fourths of Enterprises Report Positive Return on Investments"
- What it shows: This chart reinforces the positive ROI story, breaking it down by company size. It confirms that three-quarters of all enterprises are already seeing a positive return. It also highlights that smaller Tier 2 and Tier 3 enterprises are leading the way, while a quarter of the largest Tier 1 firms are still in the "too-early-to-tell" phase.
- Why it matters for the story: This provides the headline statistic on current ROI success and drives home the point that smaller, more agile companies are often faster to see the benefits of new technology.
Chart 8: "Seniority Drives ROI Perception"
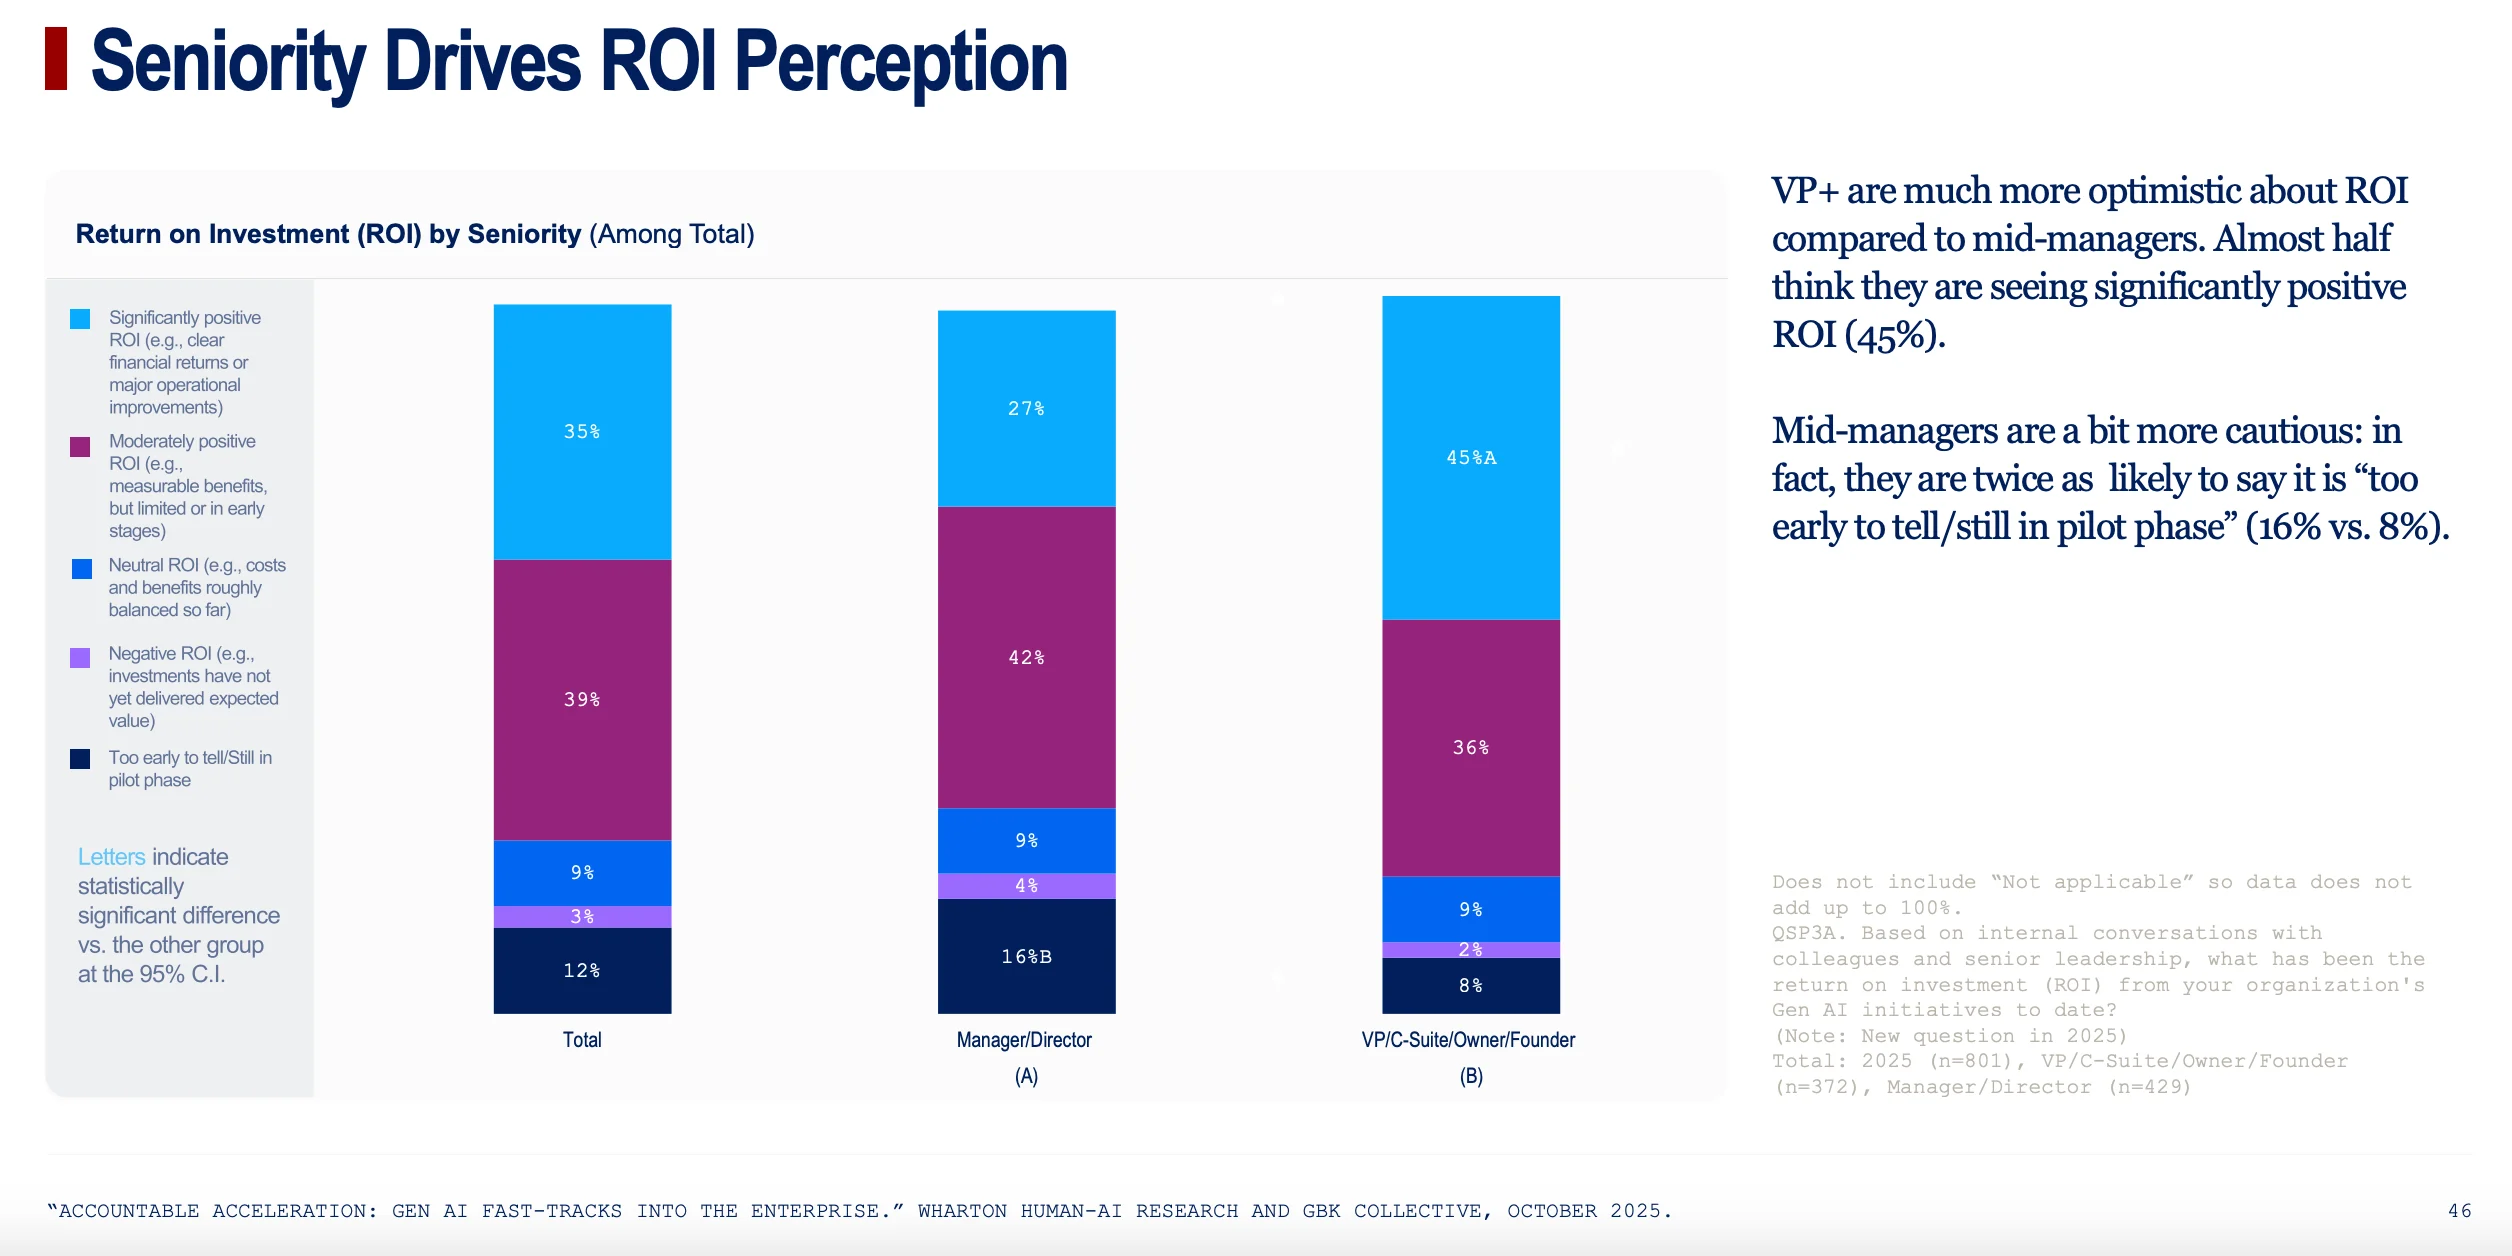
- What it shows: This reveals a fascinating perception gap between the top brass and middle management. VP+ executives are far more optimistic, with 45% believing their ROI is "significantly positive." Mid-managers are more cautious, with only 27% feeling the same way and being twice as likely to say it's "too early to tell."
- Why it matters for the story: This adds a human dimension to the data. Senior leaders see the high-level strategic vision and potential, while mid-managers are closer to the on-the-ground implementation challenges and daily realities.
Chart 9: "Knowledge and Familiarity With Gen AI Rises, Though Not All Functions Keep Pace"
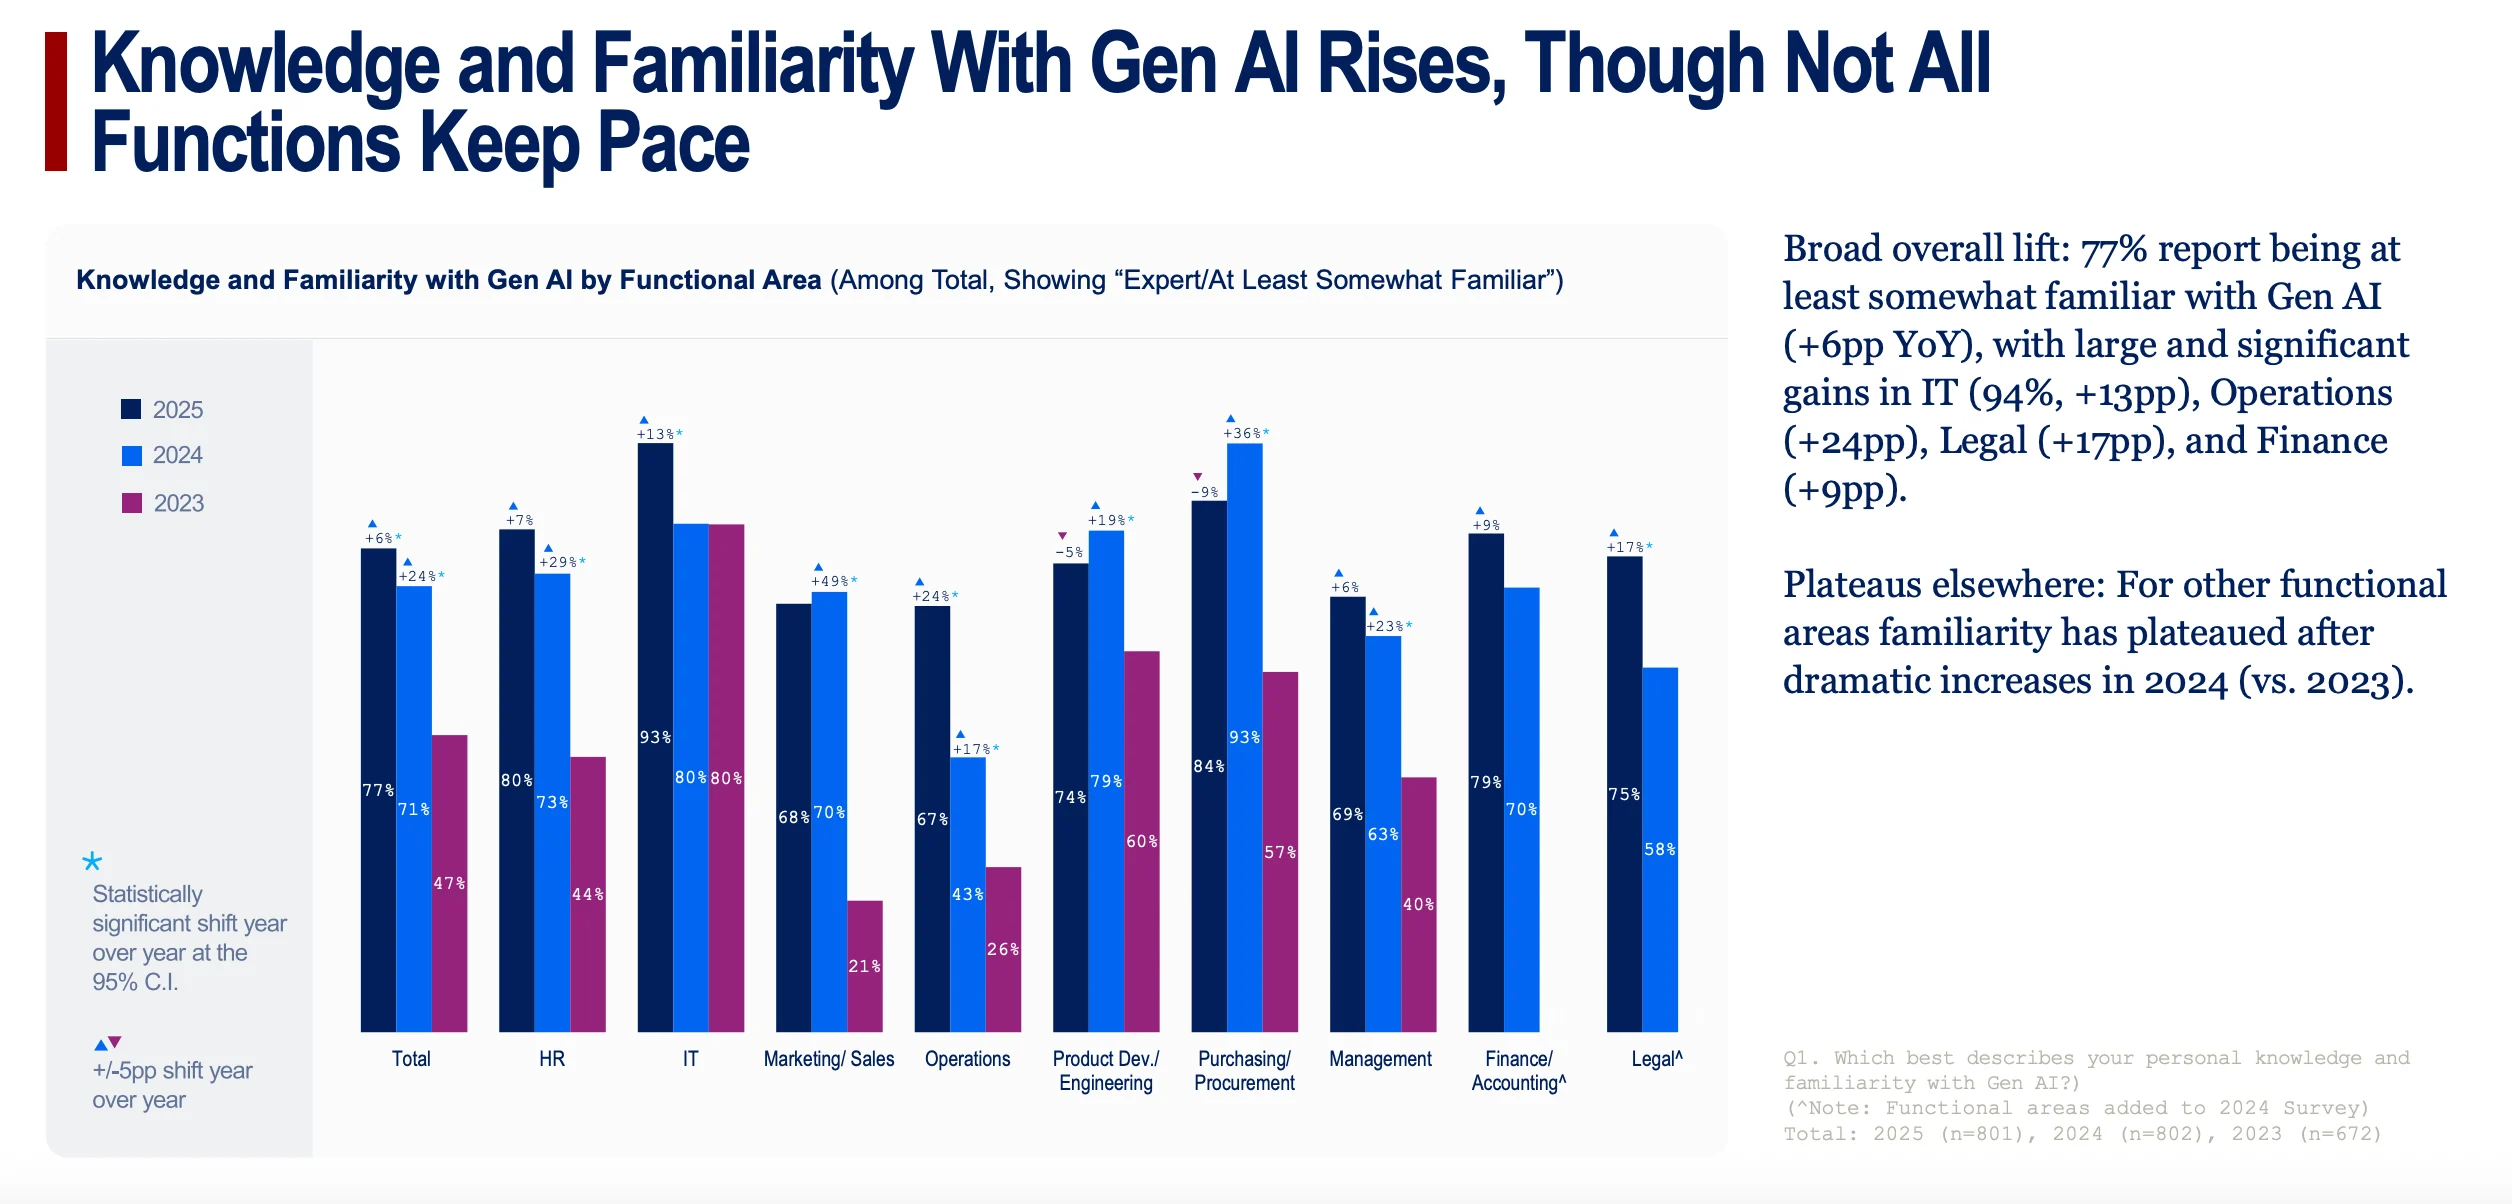
- What it shows: This chart tracks the overall rise in AI literacy. While familiarity is up across the board (77% are at least "somewhat familiar"), it highlights huge gains in specific departments like IT (+13pp), Operations (+24pp), and Legal (+17pp), while other areas have started to plateau.
- Why it matters for the story: This shows that AI knowledge is spreading, but unevenly. The departments that are becoming experts are the ones finding the most valuable use cases.
Chart 10: "Expertise Rising Broadly, Yet Weak Spots Remain in Marketing and Management"
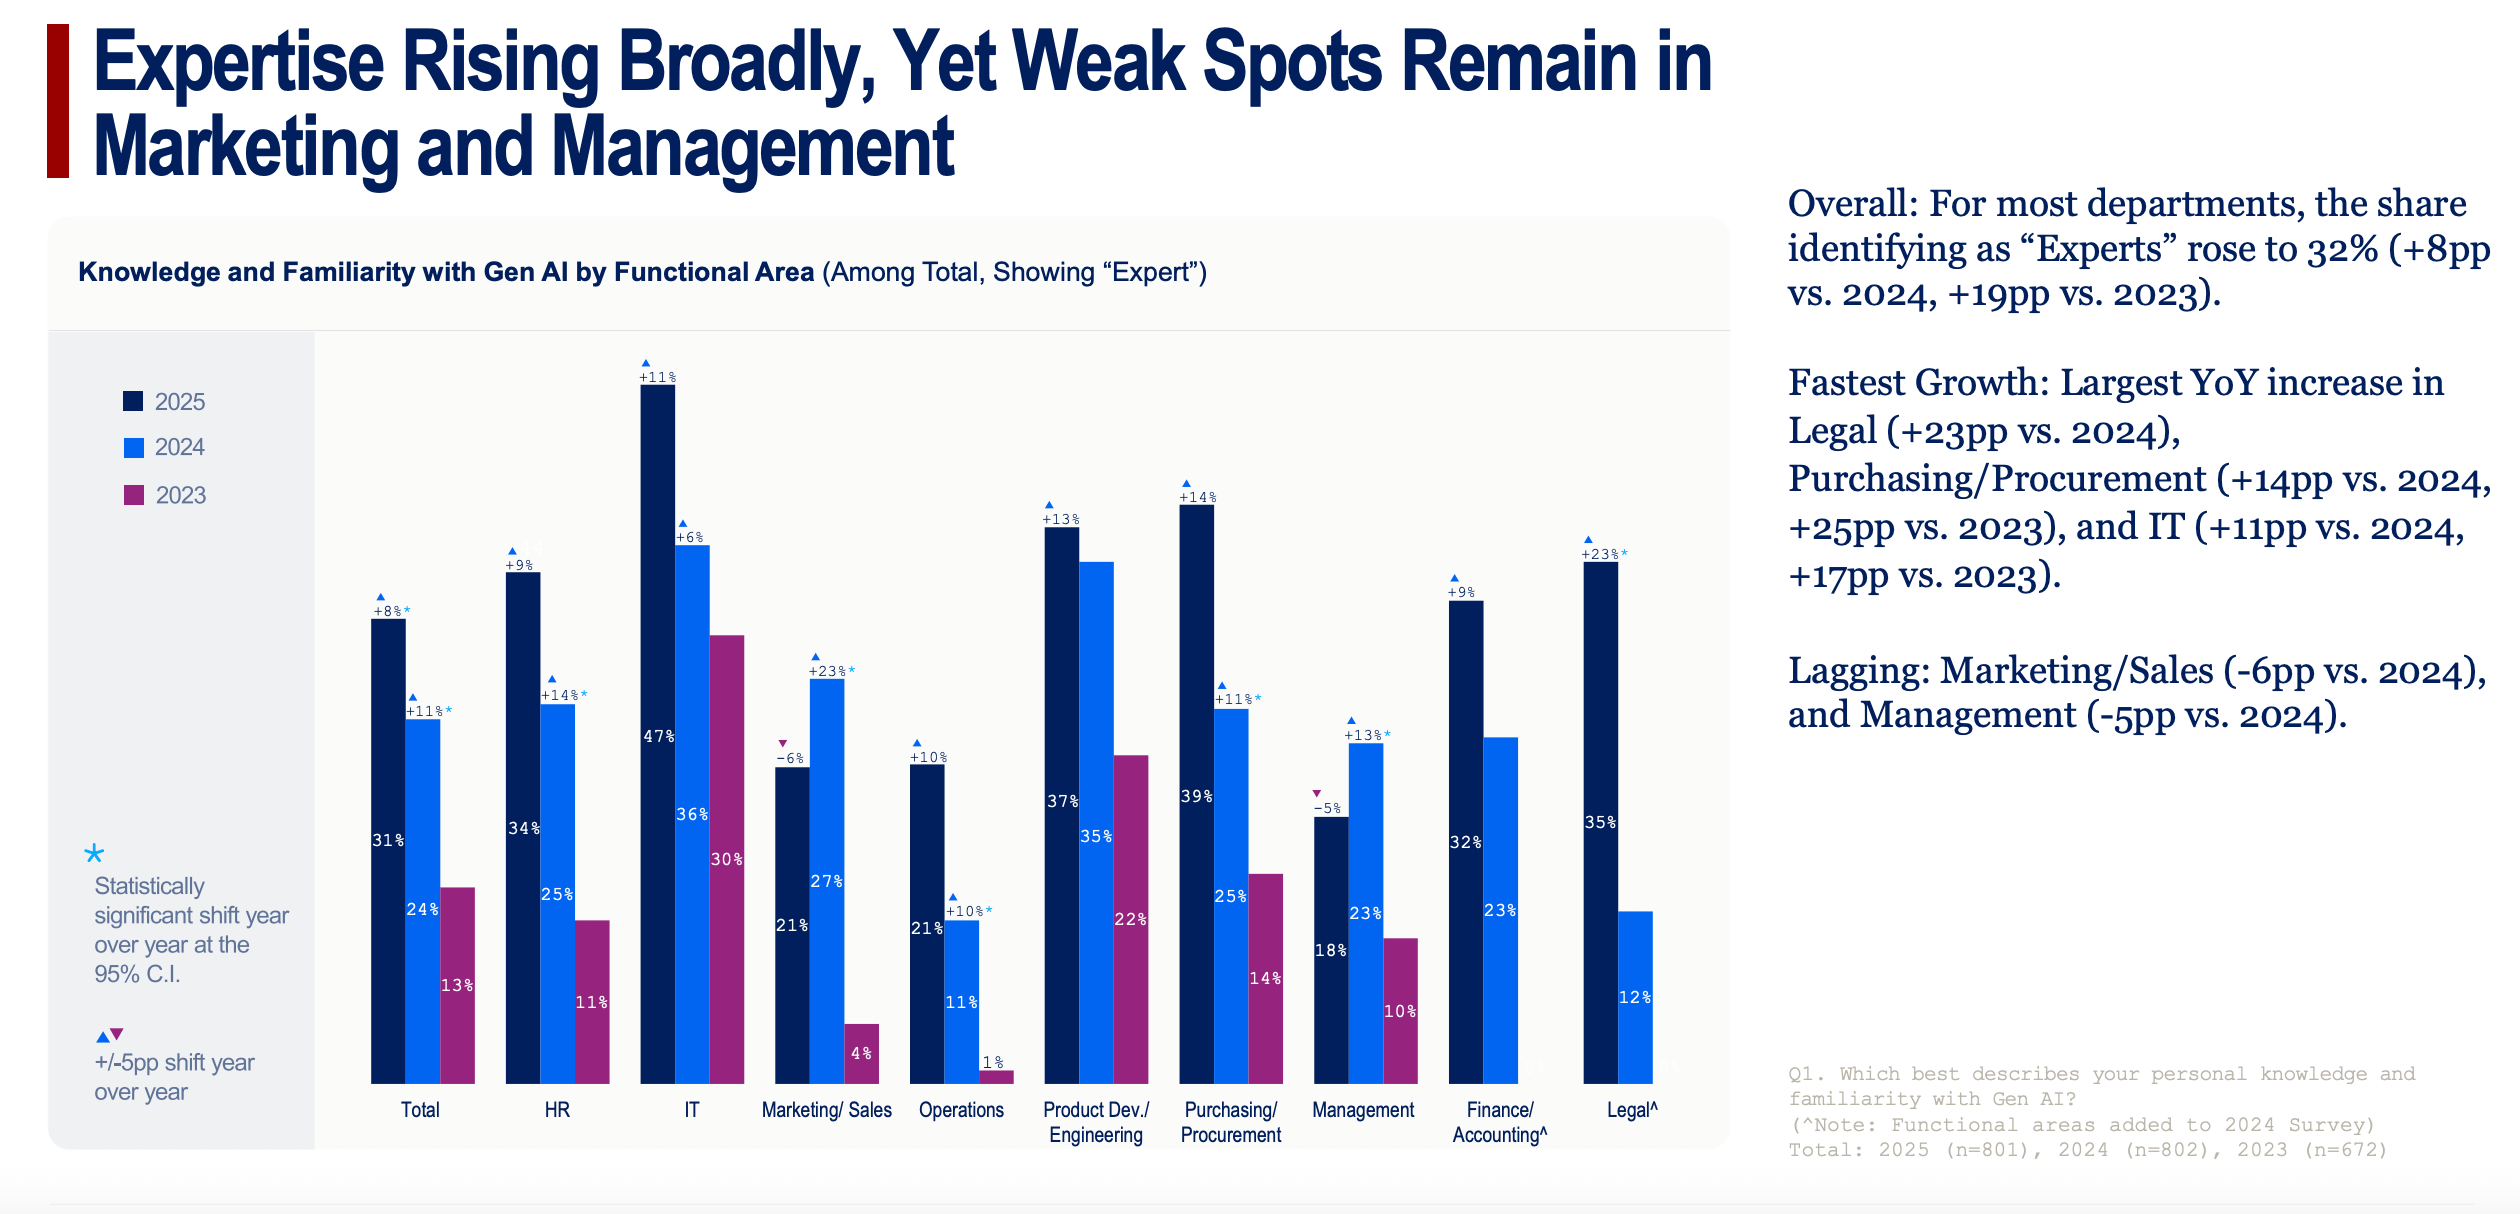
- What it shows: Drilling down further, this chart focuses on leaders who identify as "Experts." The share of experts is growing overall, but the fastest growth is in Legal (+23pp) and Purchasing/Procurement (+14pp). In contrast, expertise in Marketing/Sales actually declined (-6pp).
- Why it matters for the story: This is a crucial finding. It suggests that while some functions are rapidly mastering AI for specialized tasks, others, like Marketing, may be hitting a wall or struggling to move beyond basic applications. This flags a potential skill gap.
Chart 11: "Decision-Makers 55+ Are Closing the Gen AI Gap"
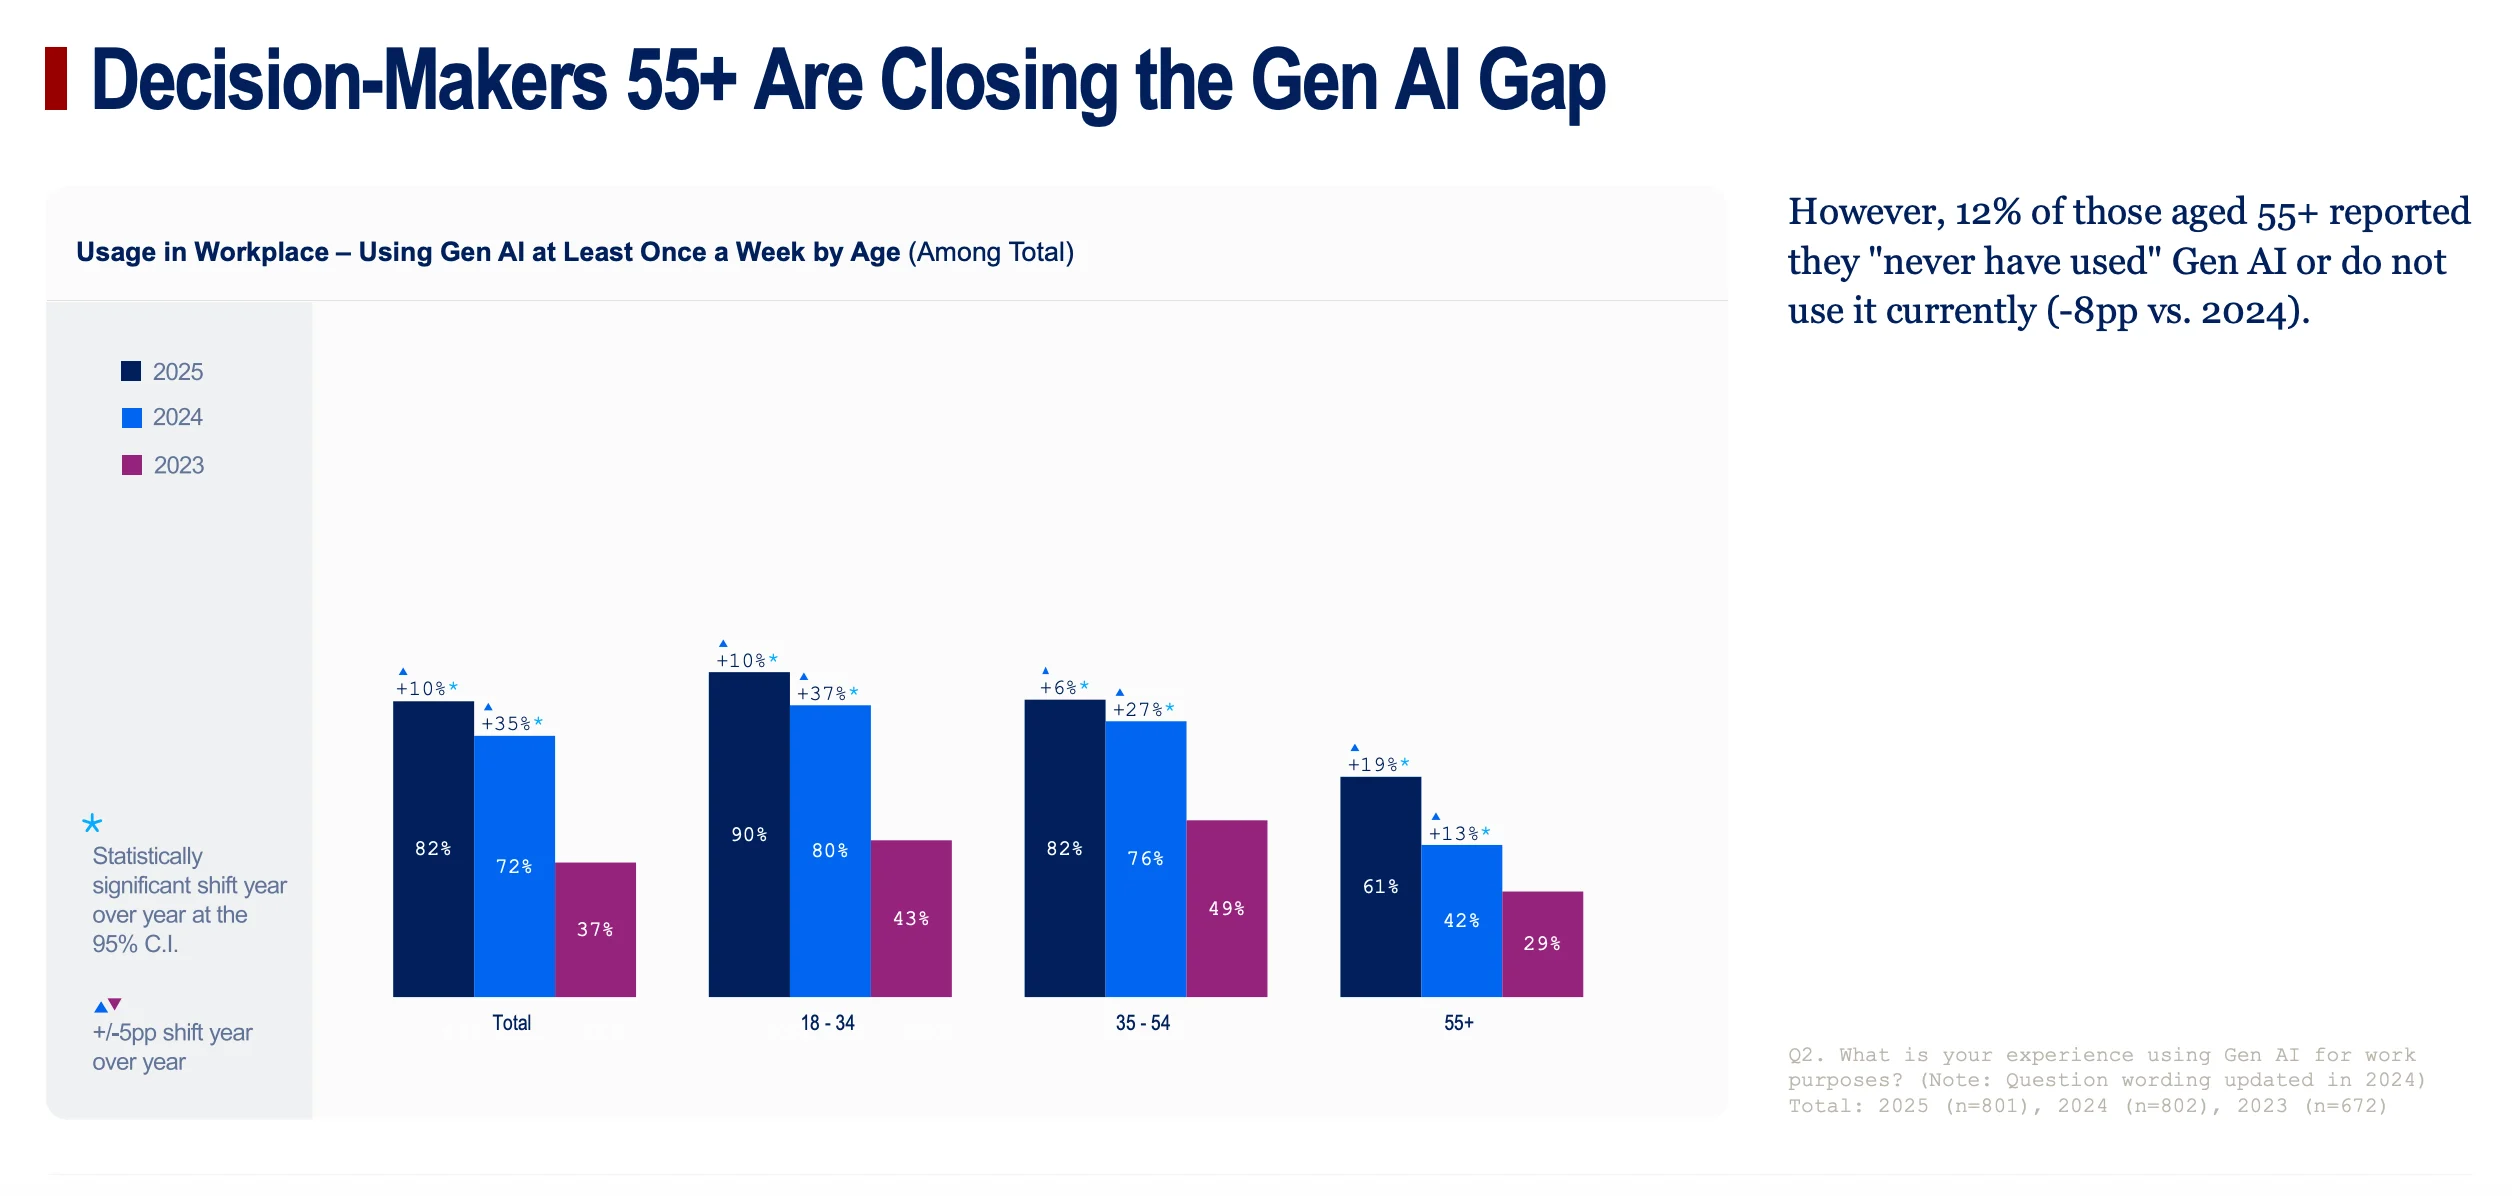
- What it shows: A simple but powerful demographic story. Weekly AI usage among leaders aged 55 and over has jumped to 61% (+19pp YoY).
- Why it matters for the story: This dispels the myth that AI is just a tool for younger, digitally native generations. Senior, experienced leaders are actively adopting and using Gen AI, showing its broad appeal and utility across the entire workforce.
Chart 12: "Most Industries See Rapid Uptake of Gen AI, Except Retail"
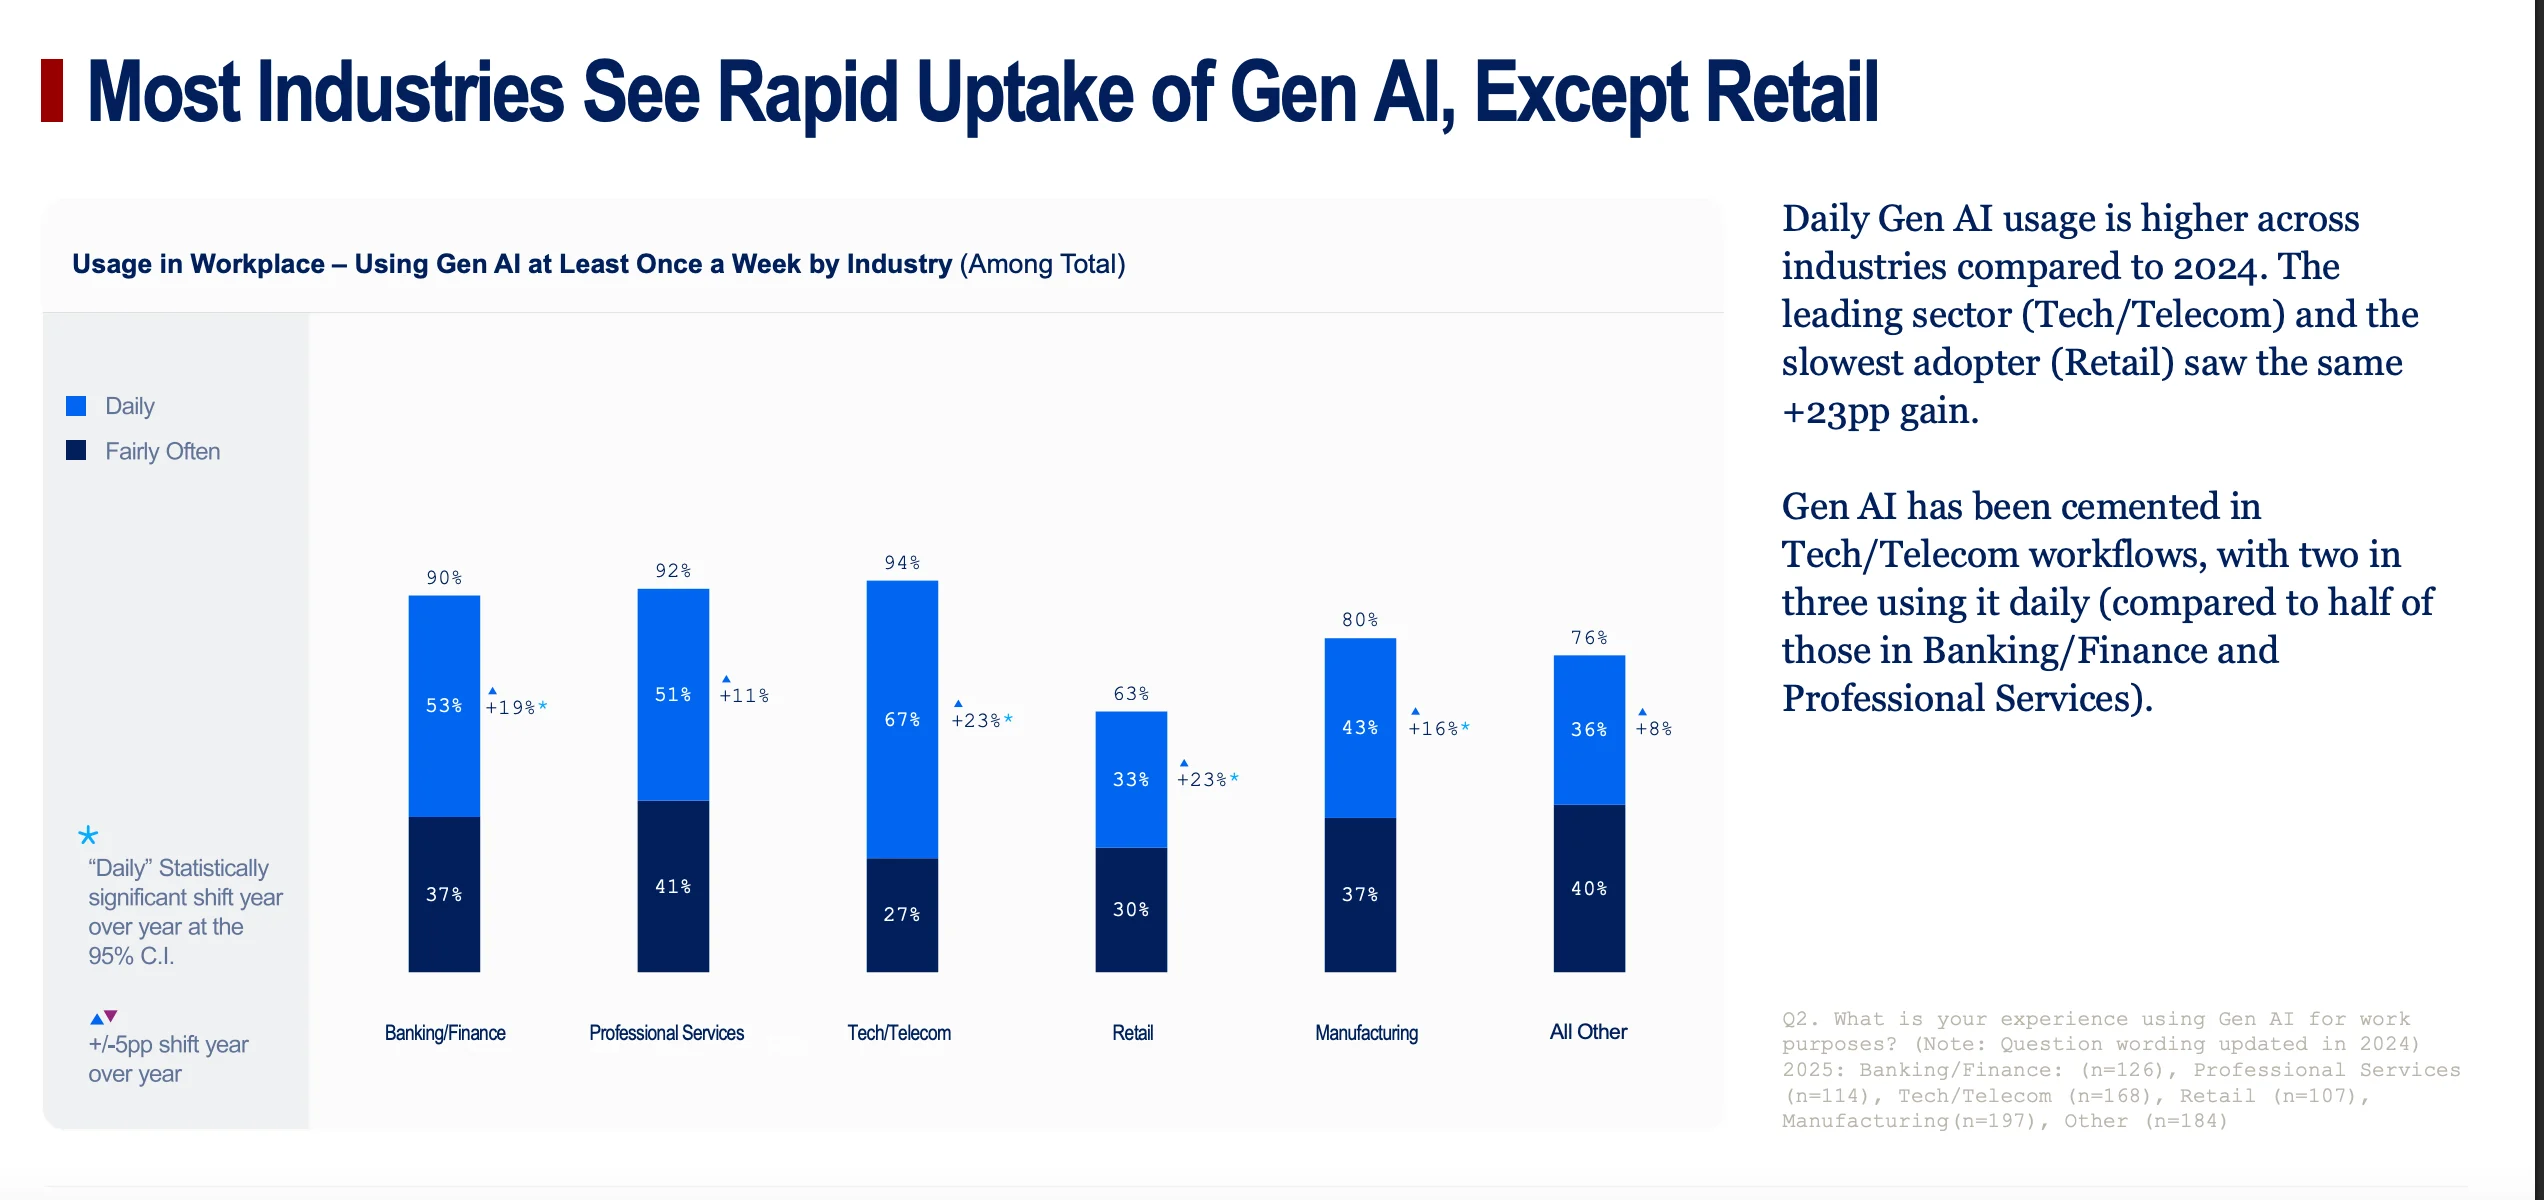
- What it shows: This chart provides another view of the industry divide, focusing on usage frequency. Tech/Telecom is cemented as the leader, with two-thirds of leaders using AI daily. Retail is the clear laggard.
- Why it matters for the story: This reinforces the "tale of two industries" narrative with hard data on daily use, showing how deeply embedded AI has become for the leaders versus the laggards.
Chart 13: "Smaller Enterprises See Themselves as More Agile in Gen AI Adoption"
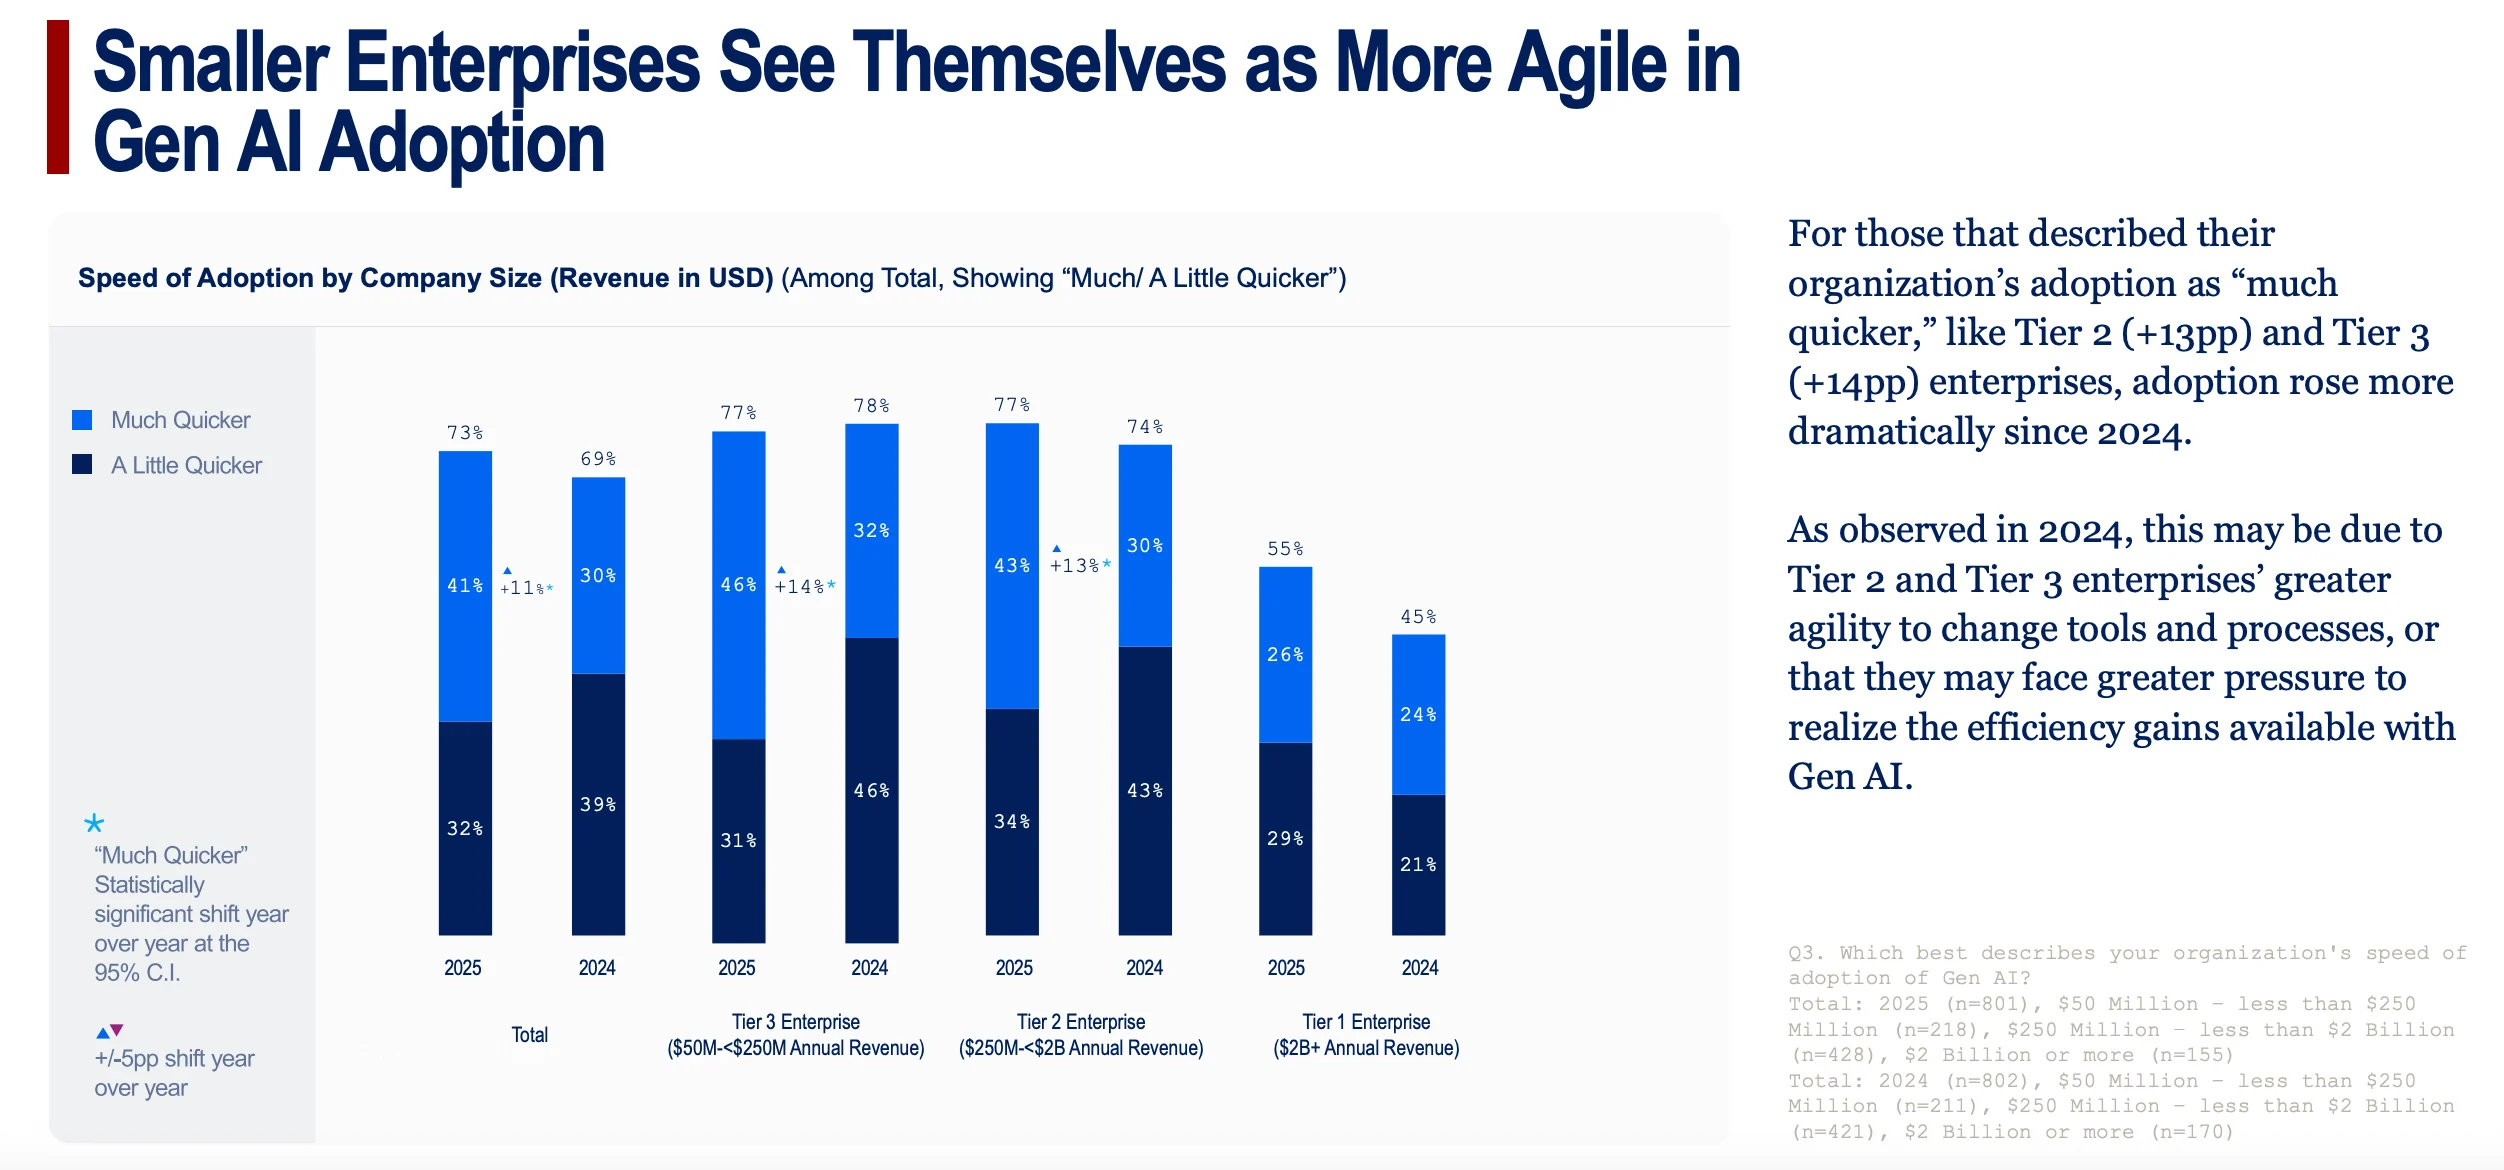
- What it shows: This chart is about self-perception. Leaders at smaller companies (Tier 2 and 3) are much more likely to describe their organization's adoption speed as "much quicker" than leaders at large Tier 1 enterprises.
- Why it matters for the story: This confirms the theme that agility is a key advantage in the AI era. Smaller companies can change tools and processes more quickly to capitalize on efficiency gains.
Chart 14: "Adoption Speed: VP+ See Acceleration, Mid-Managers Less So"
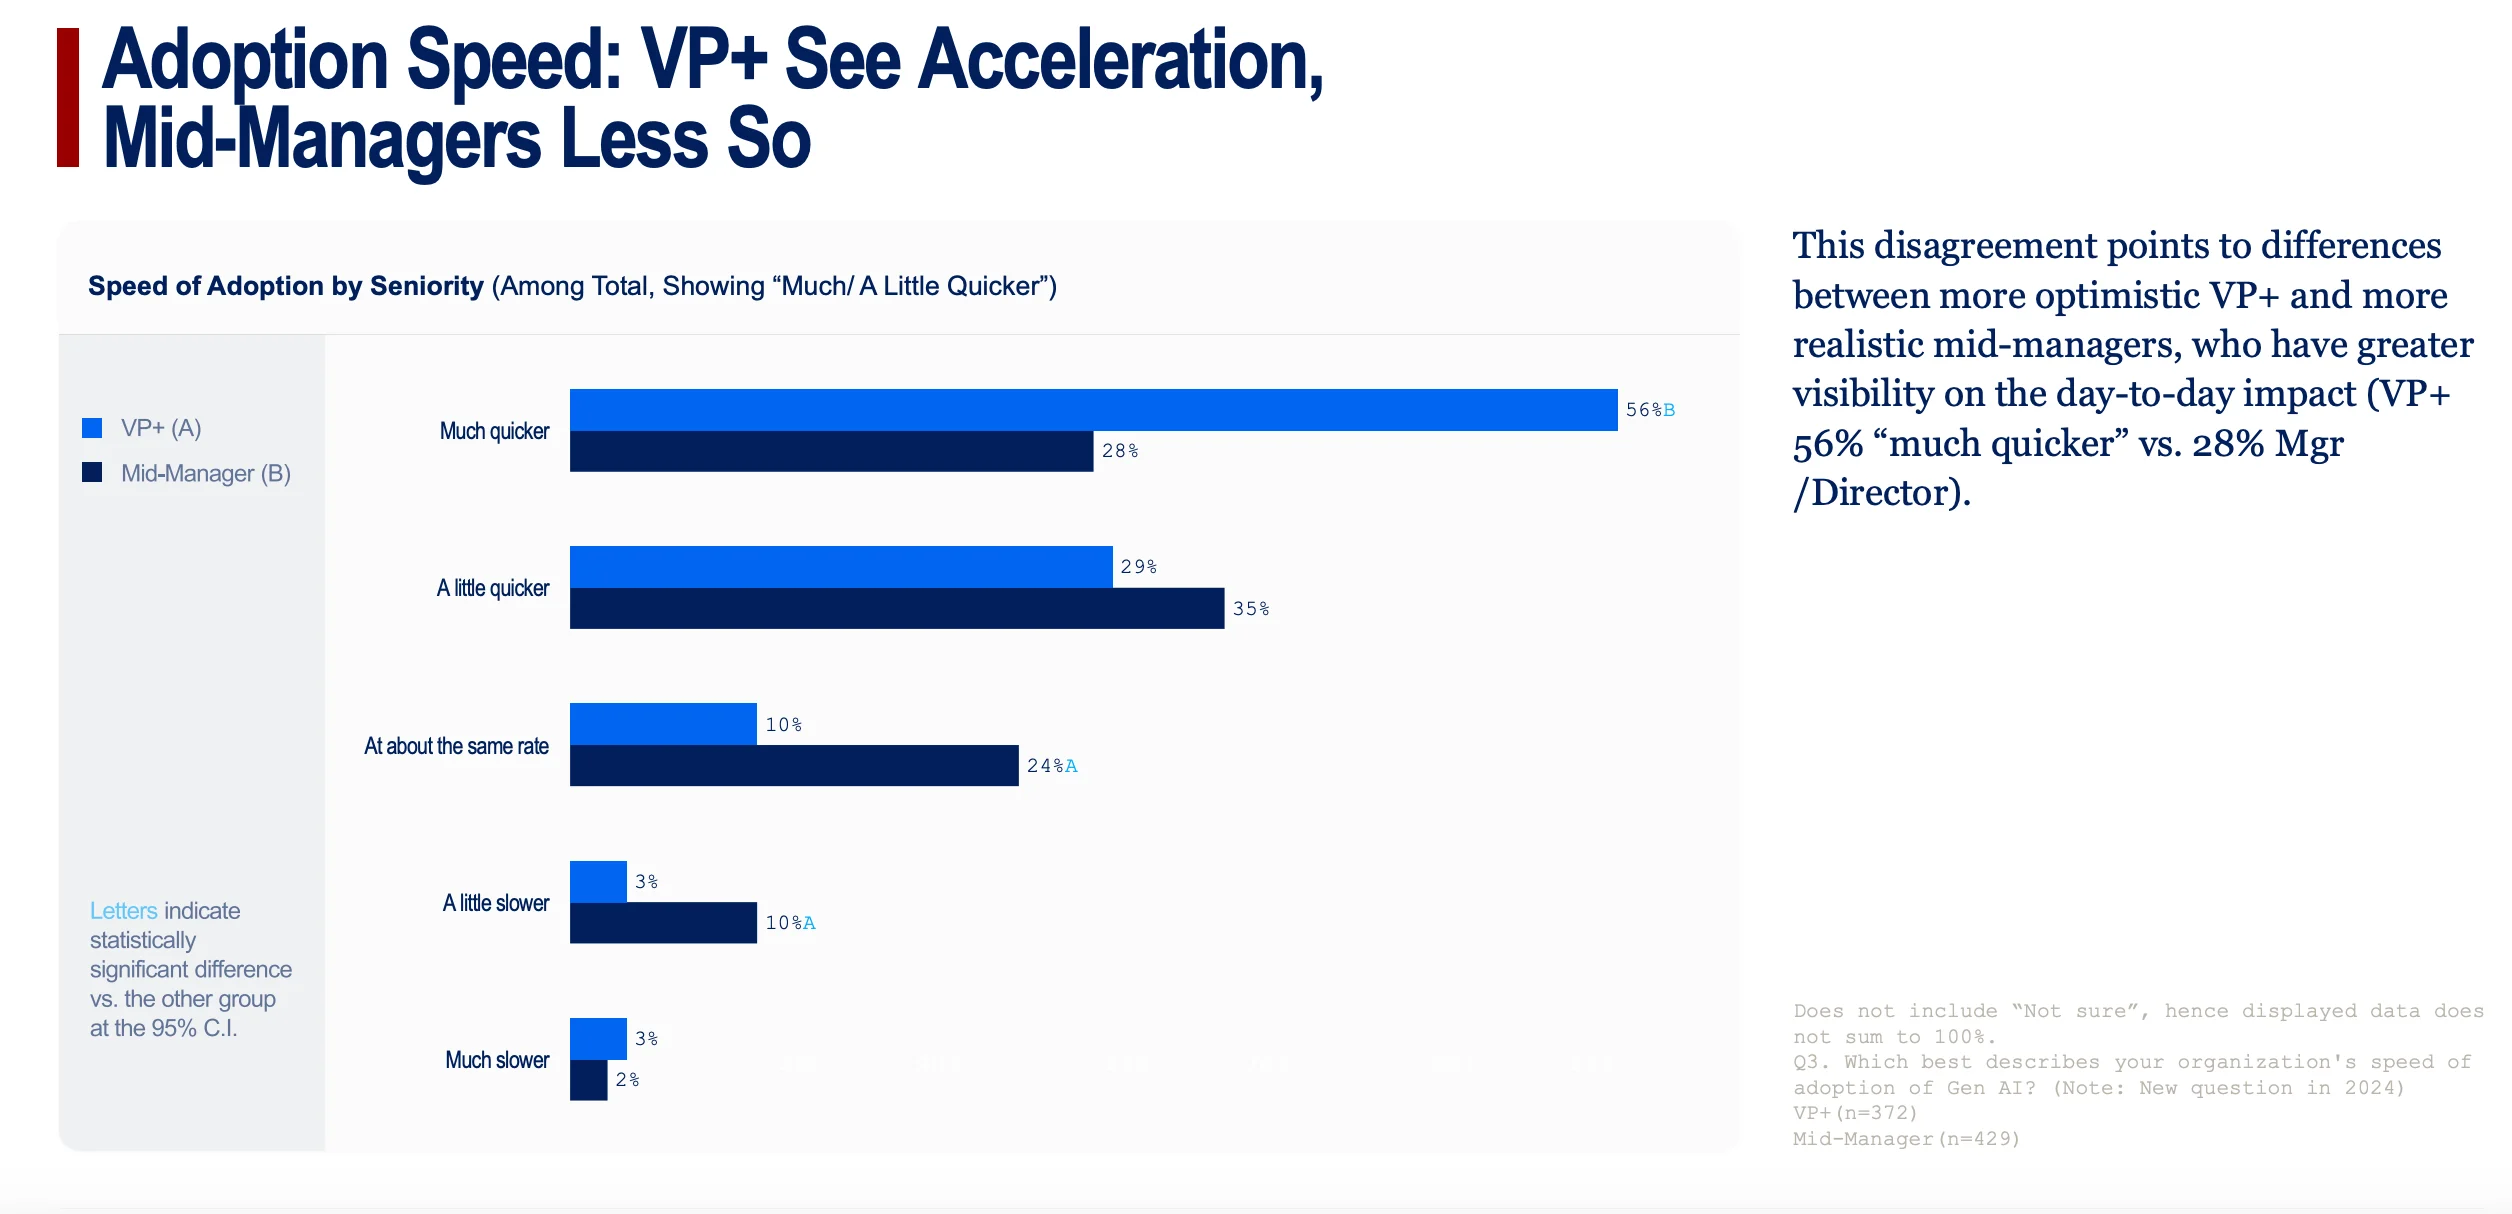
- What it shows: This is the same perception gap from the ROI chart, but applied to adoption speed. 56% of VP+ leaders think their company's adoption is "much quicker" than others, compared to only 28% of mid-managers.
- Why it matters for the story: It highlights the disconnect between the C-suite's strategic push and the reality on the ground. VPs are setting an aggressive pace, but mid-managers, who handle the day-to-day implementation, have a more tempered view.
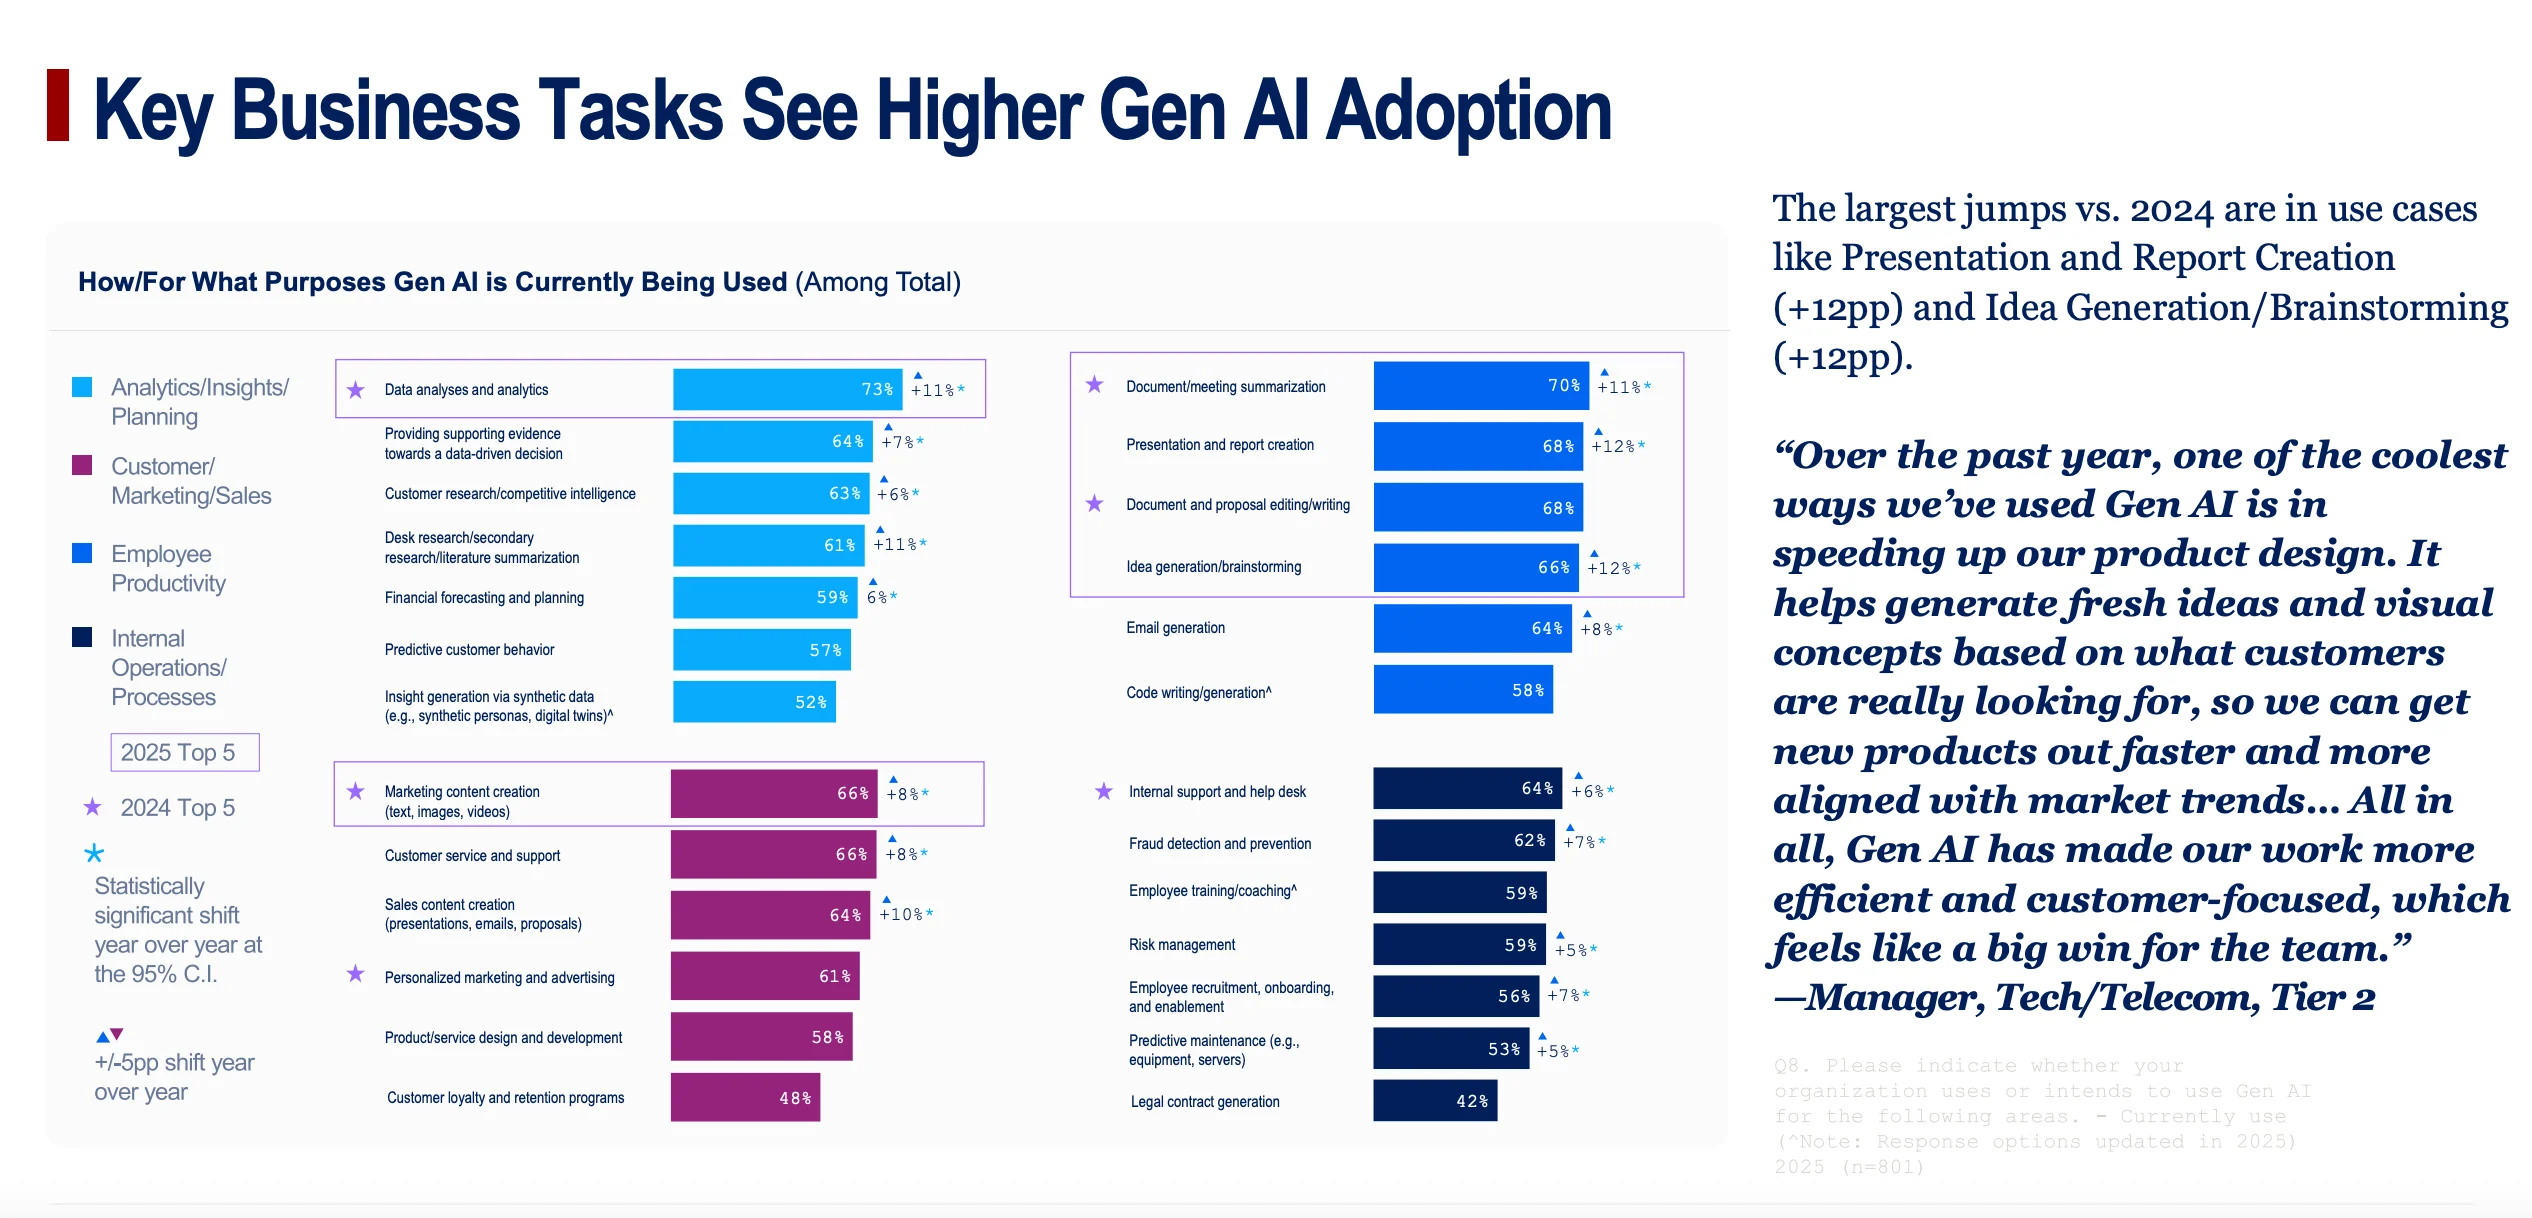
Chart 15: "Key Business Tasks See Higher Gen AI Adoption"
- What it shows: This is the definitive list of what people are actually doing with Gen AI. It visually ranks the top use cases, dominated by employee productivity tasks like data analysis (73%), summarization (70%), and content creation (68%). The largest year-over-year jumps were in presentation creation and brainstorming.
- Why it matters for the story: This provides the concrete, "rubber-meets-the-road" examples for your article. It shows that the current value of AI lies in making everyday work faster and easier.
Chart 16: "Half of Top 10 Gen AI Use Cases Directly Boost Employee Productivity"
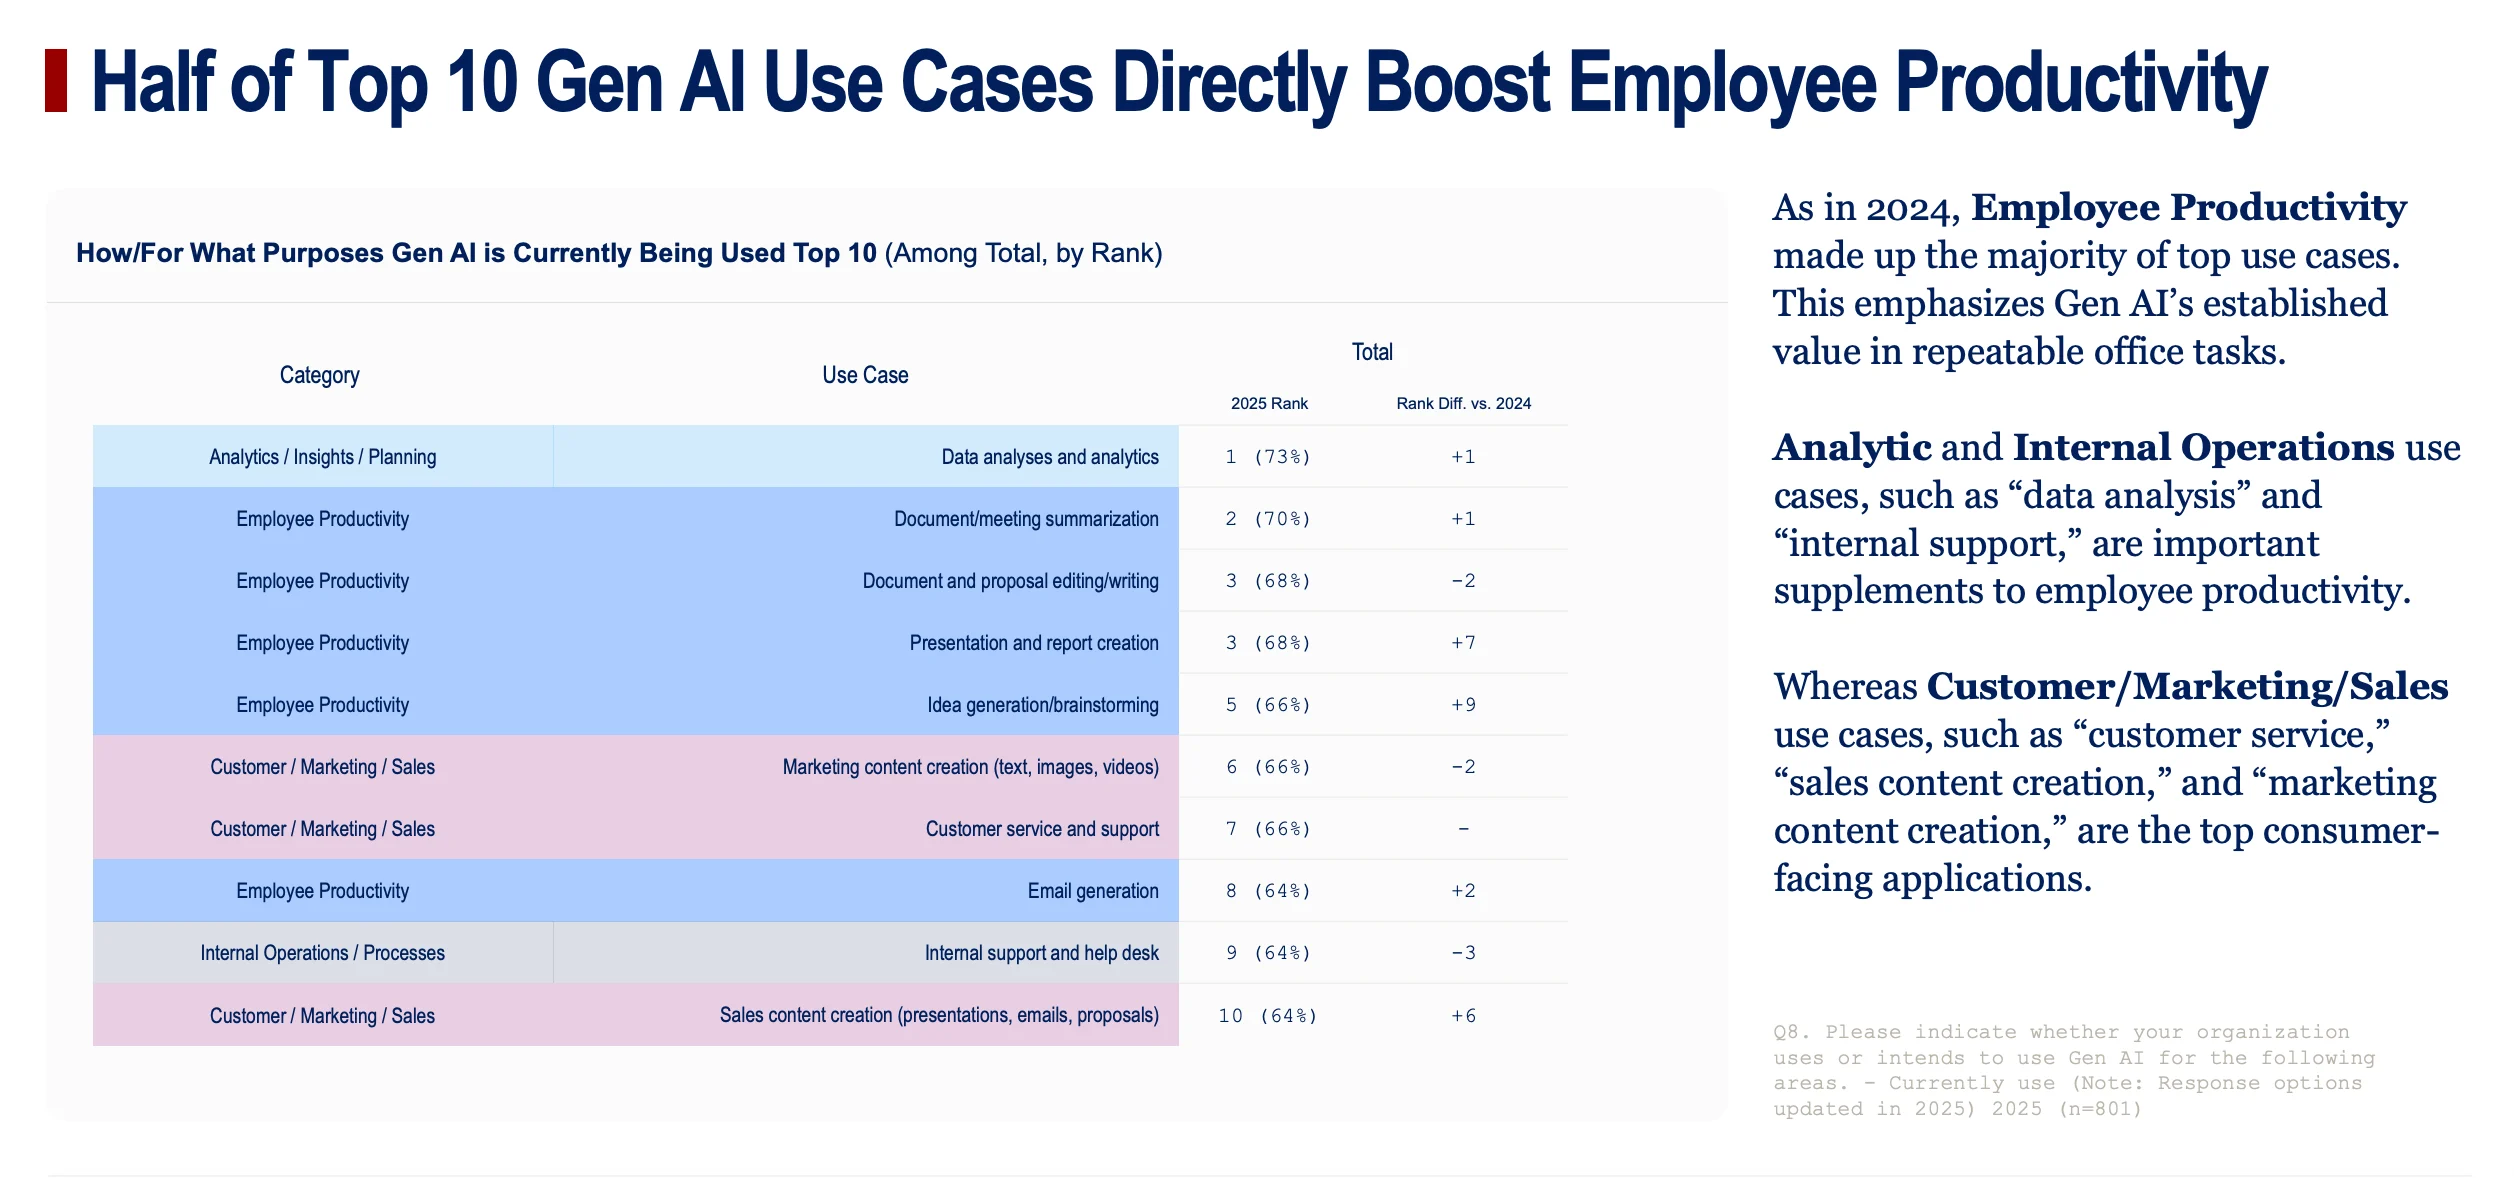
- What it shows: This table organizes the top 10 use cases by category, making it explicit that five of the top 10 are purely "Employee Productivity" tasks.
- Why it matters for the story: This drives home the main theme of AI's current role in the enterprise. It’s not about replacing entire job functions (yet), but about augmenting individual workers and making them more efficient at their existing jobs.
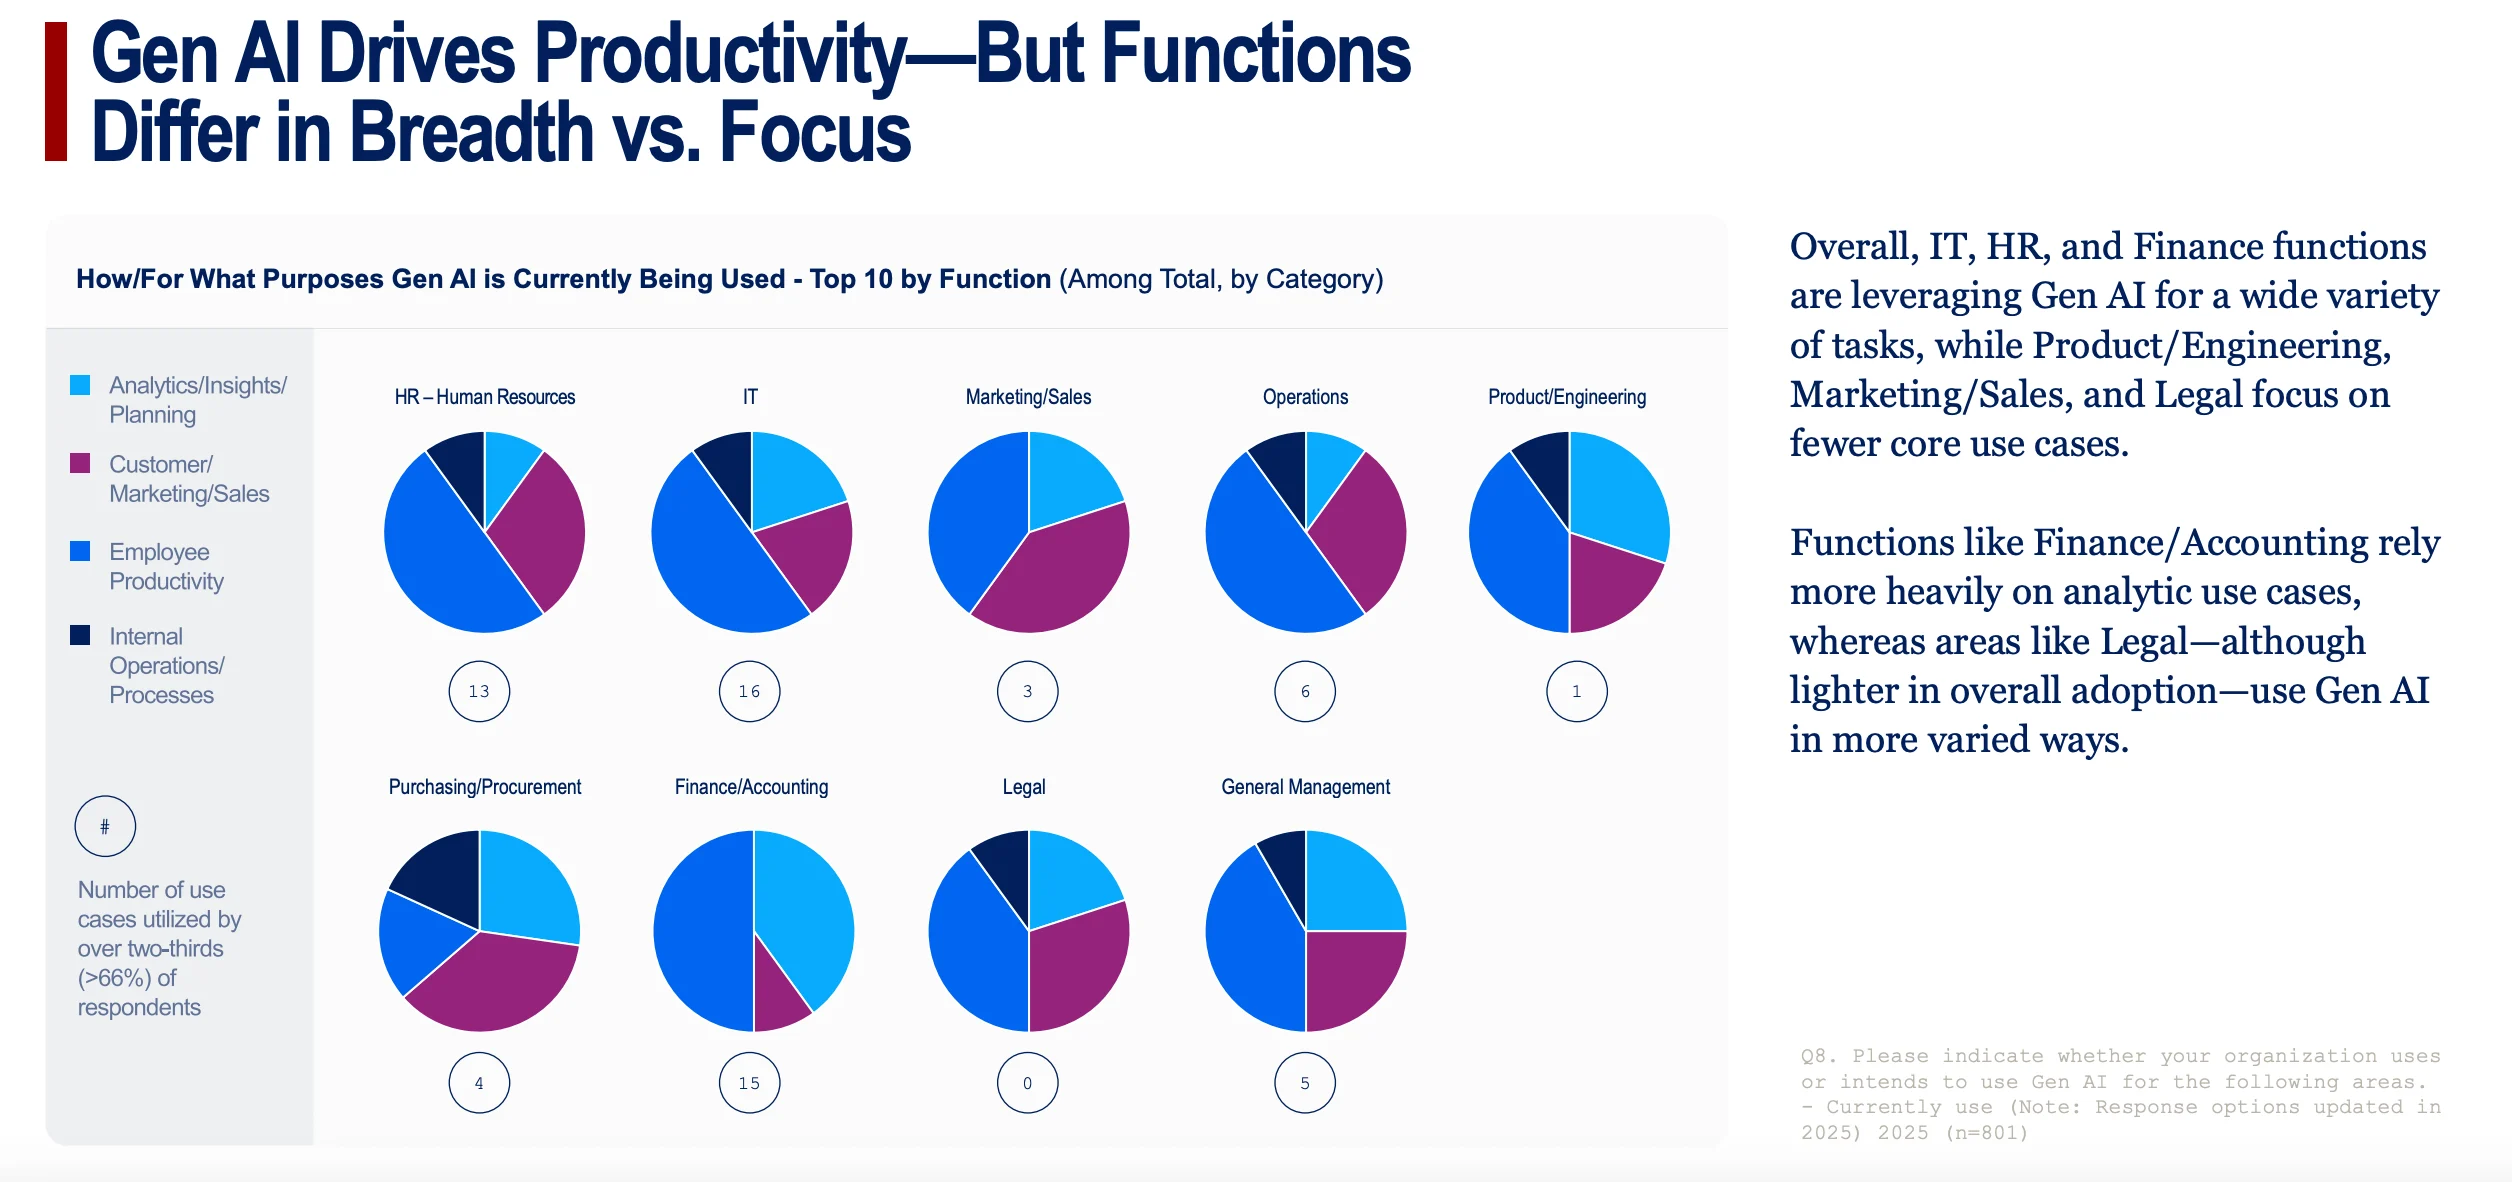
Chart 17: "Gen AI Drives Productivity—But Functions Differ in Breadth vs. Focus"
- What it shows: The pie charts provide a fantastic visual of how different departments use AI. It shows that some functions, like IT and HR, use AI for a broad variety of tasks (breadth), while others, like Legal and Marketing/Sales, are more specialized, focusing on fewer core use cases (depth).
- Why it matters for the story: This adds nuance to the adoption story. It’s not one-size-fits-all. Some departments are finding many small uses for AI, while others have found one or two "killer apps" that they rely on heavily.
Chart 18: "Functions Find Their Fit With Gen AI"
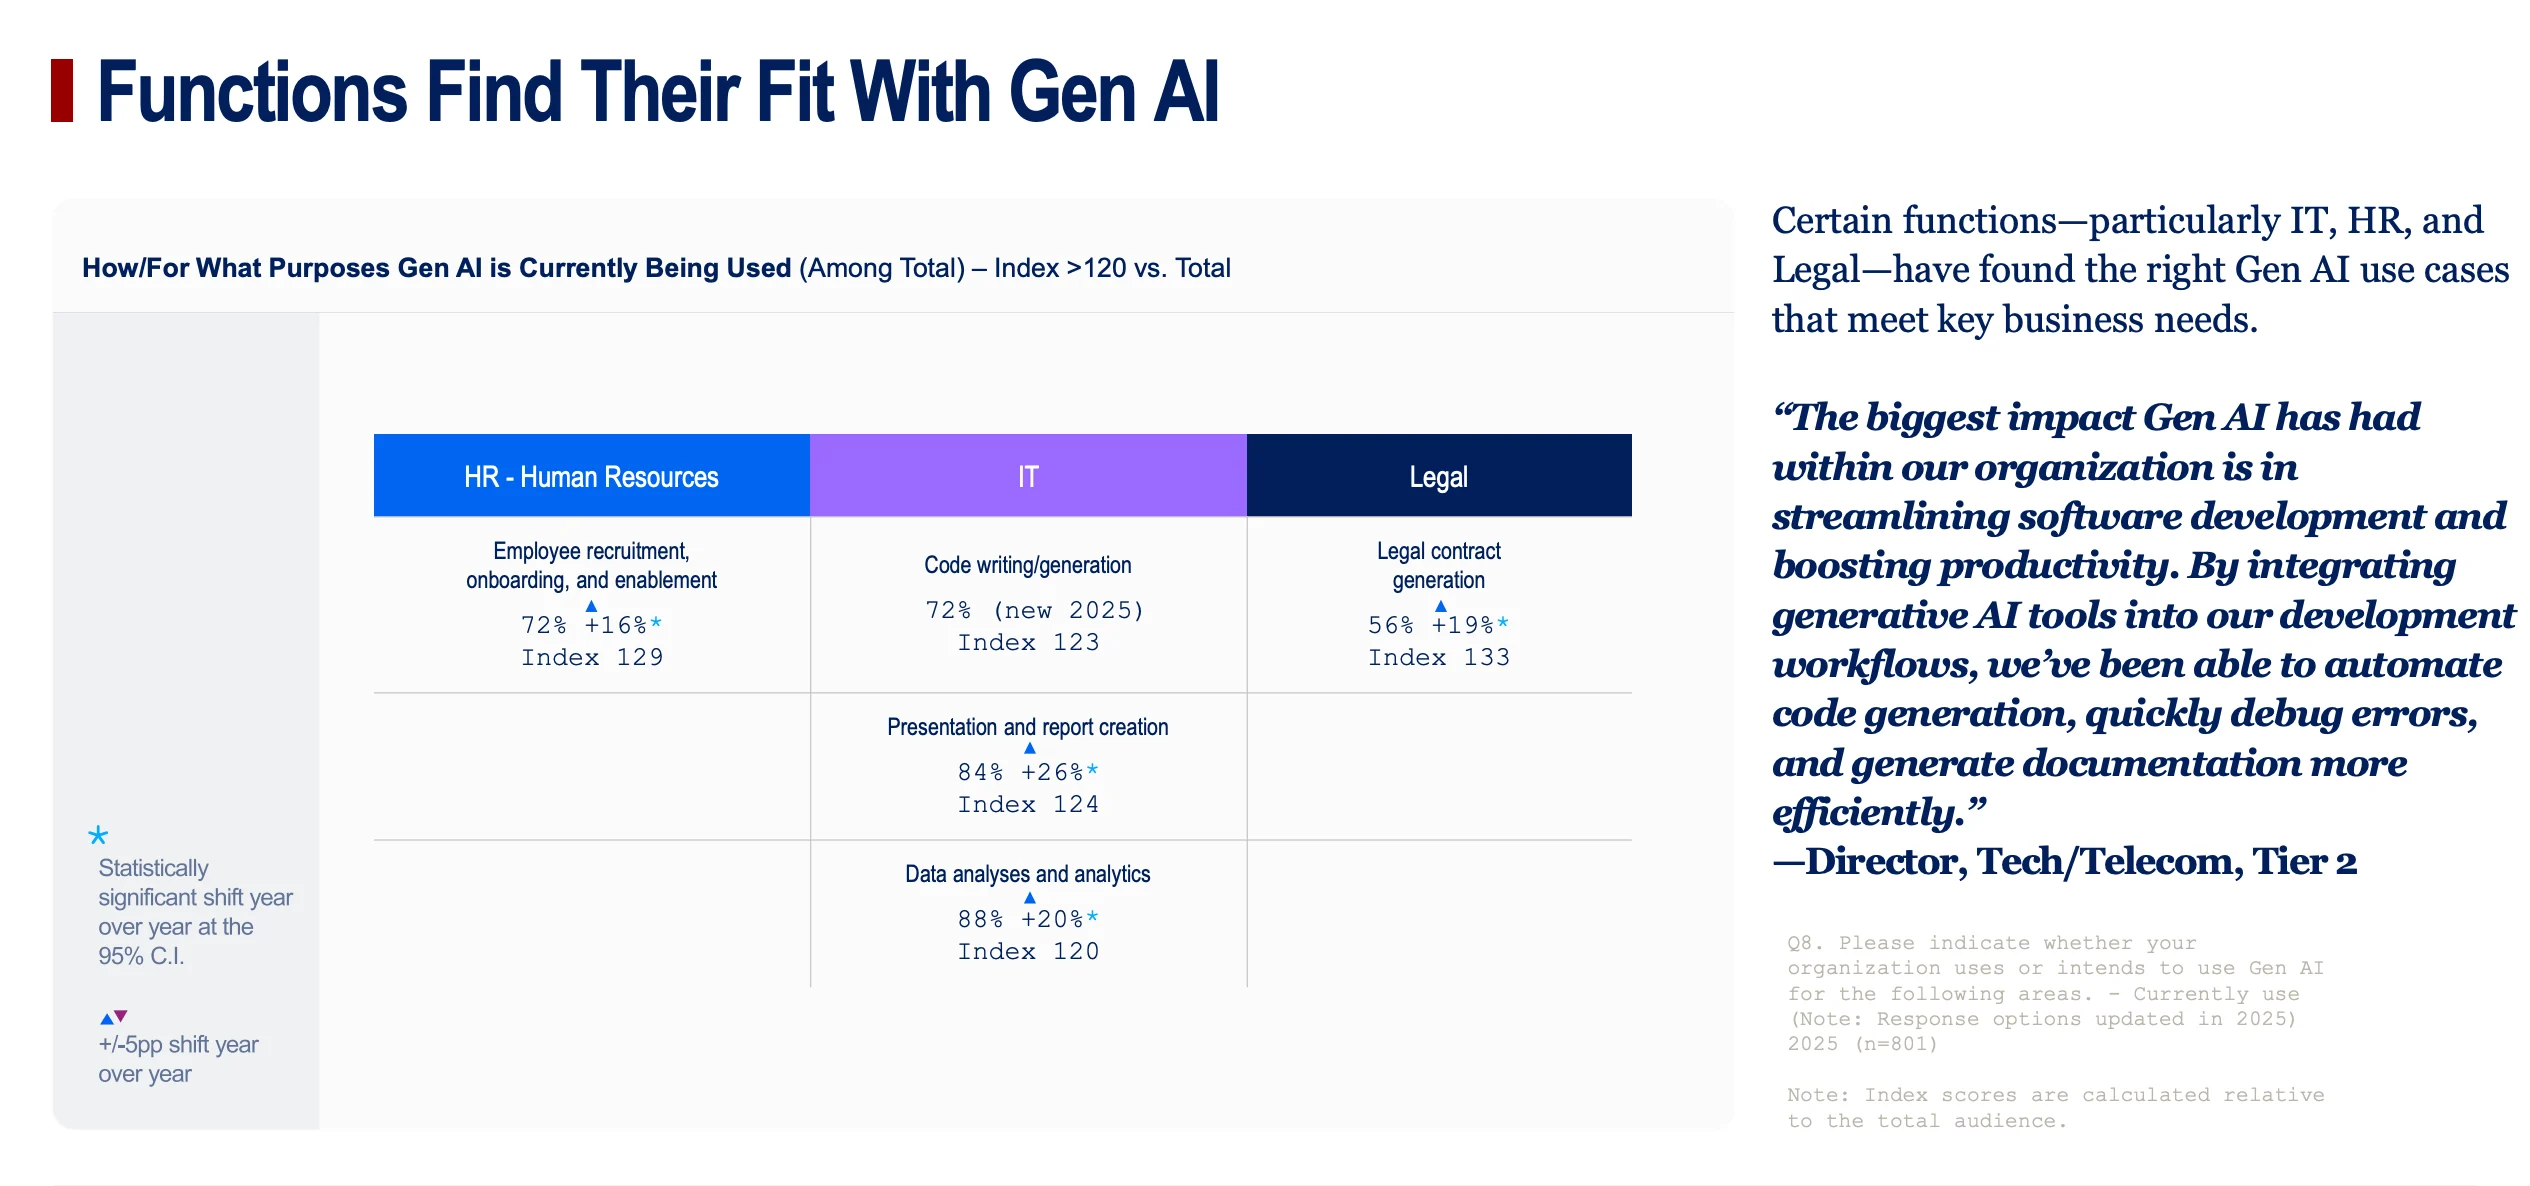
- What it shows: This chart highlights the "killer apps" with hard data. It shows that usage for specific tasks in HR (recruitment, indexing at 129), IT (coding, 123), and Legal (contracts, 133) is dramatically higher than the enterprise average.
- Why it matters for the story: This is powerful evidence of specialized success. These are the home-run use cases that are providing undeniable value and driving deep adoption within specific departments.
Chart 19: "Top Use Cases Are Also Top Performers"
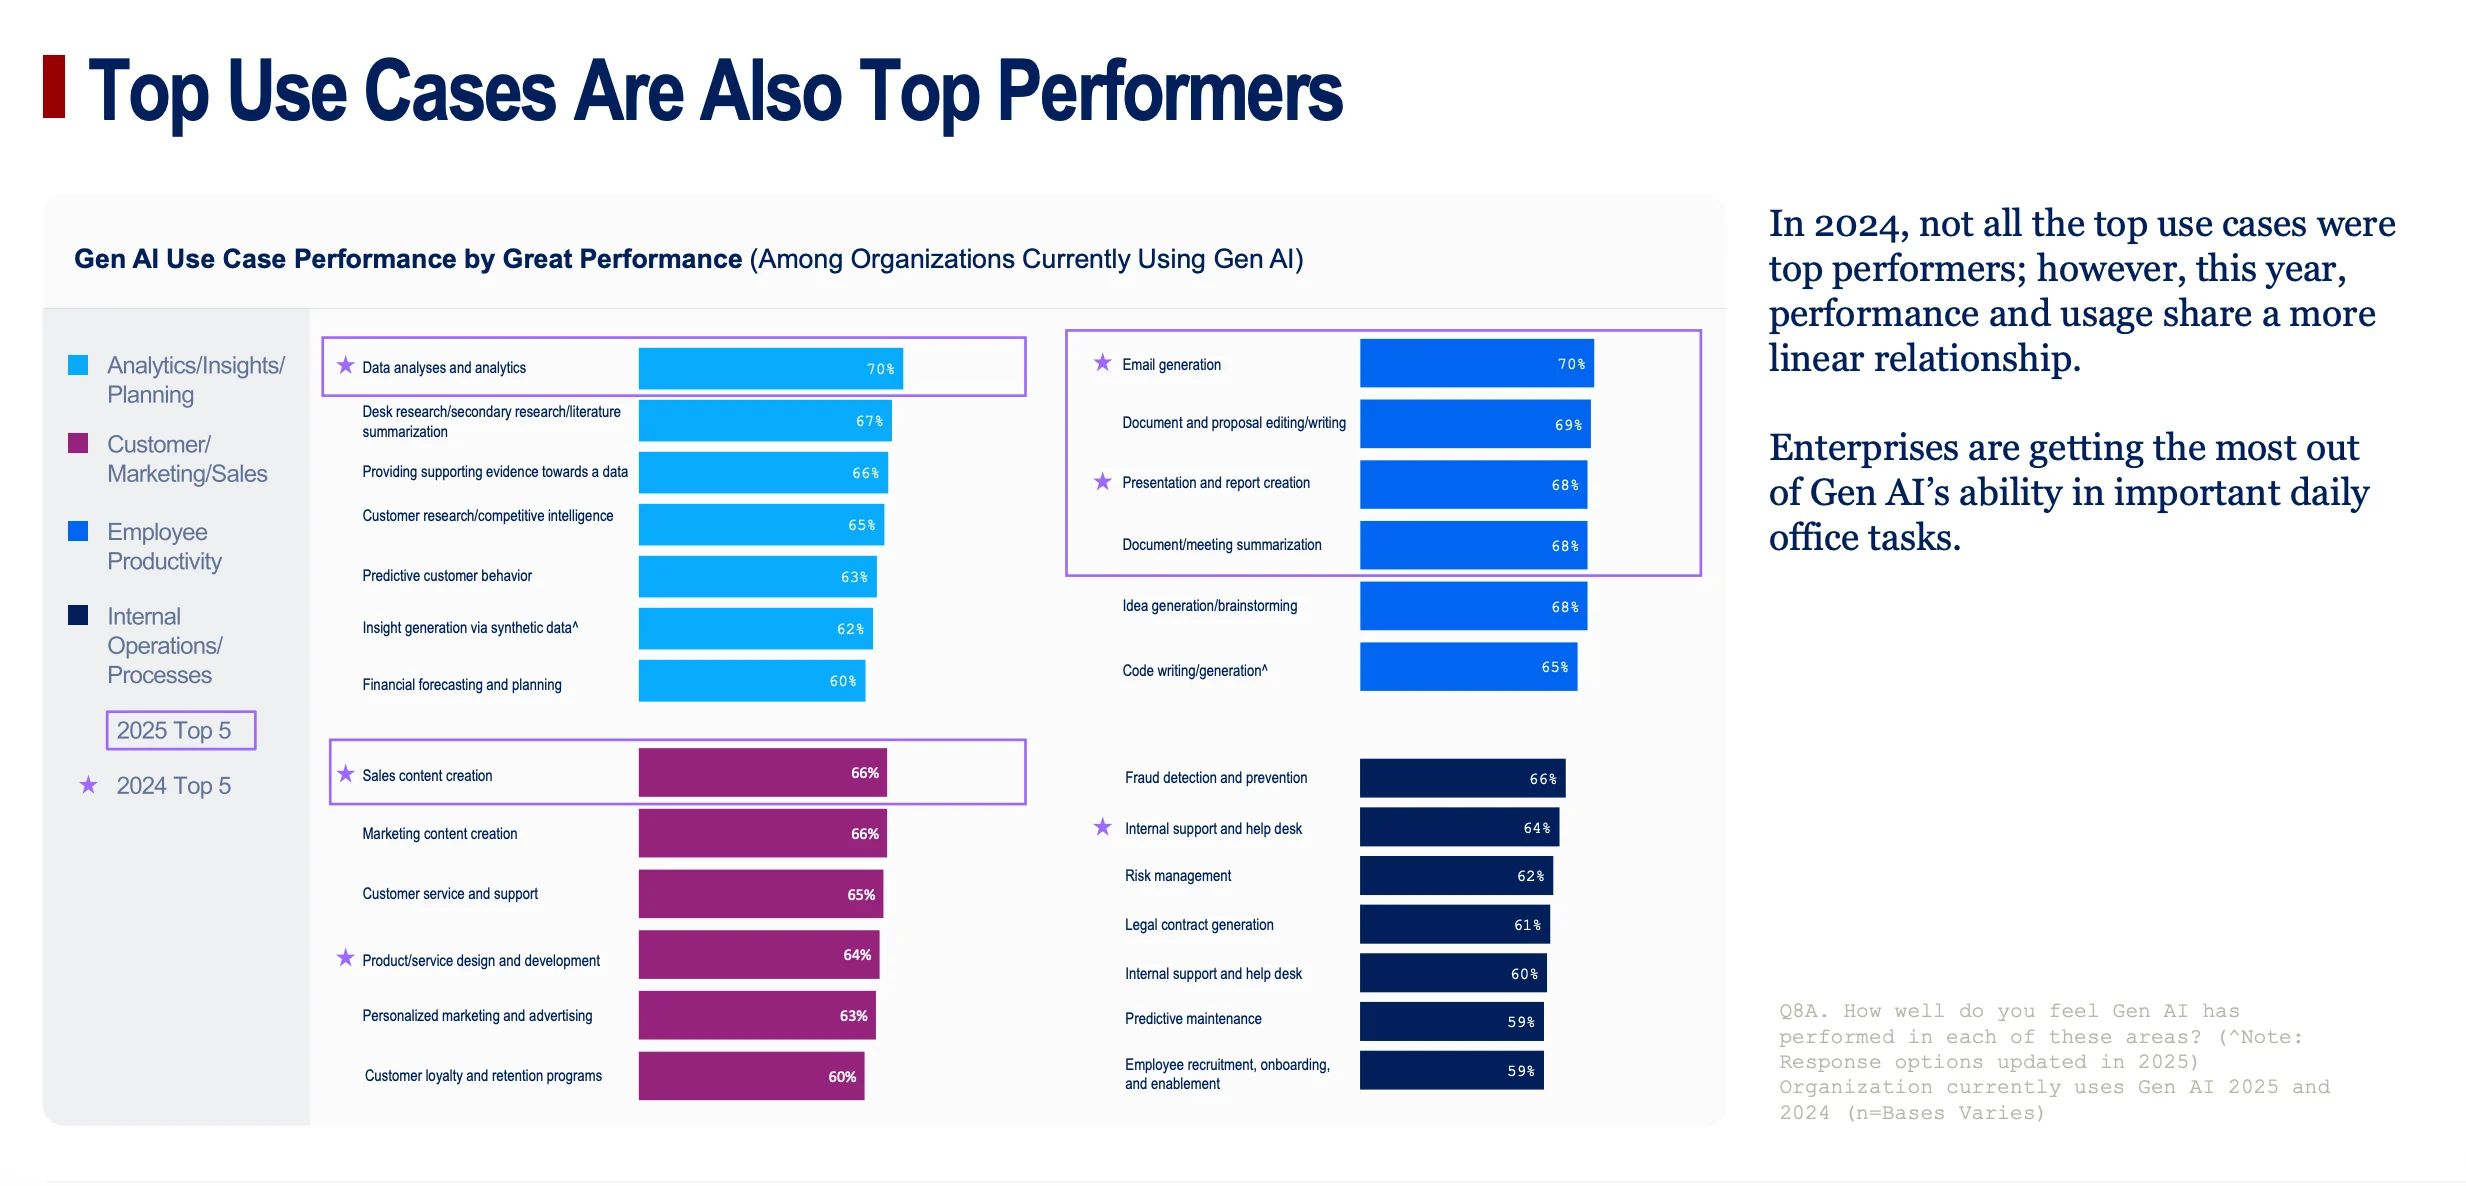
- What it shows: A simple but critical point: the tasks that are most popular are also the ones that are rated highest for performance. There's a strong linear relationship between adoption and success.
- Why it matters for the story: This indicates that the market is maturing. Companies aren't just trying things randomly anymore; they are successfully identifying what works and doubling down on those high-performing applications.
Chart 20: "ChatGPT and Copilot Dominate Usage, Other Tools Lag Behind"
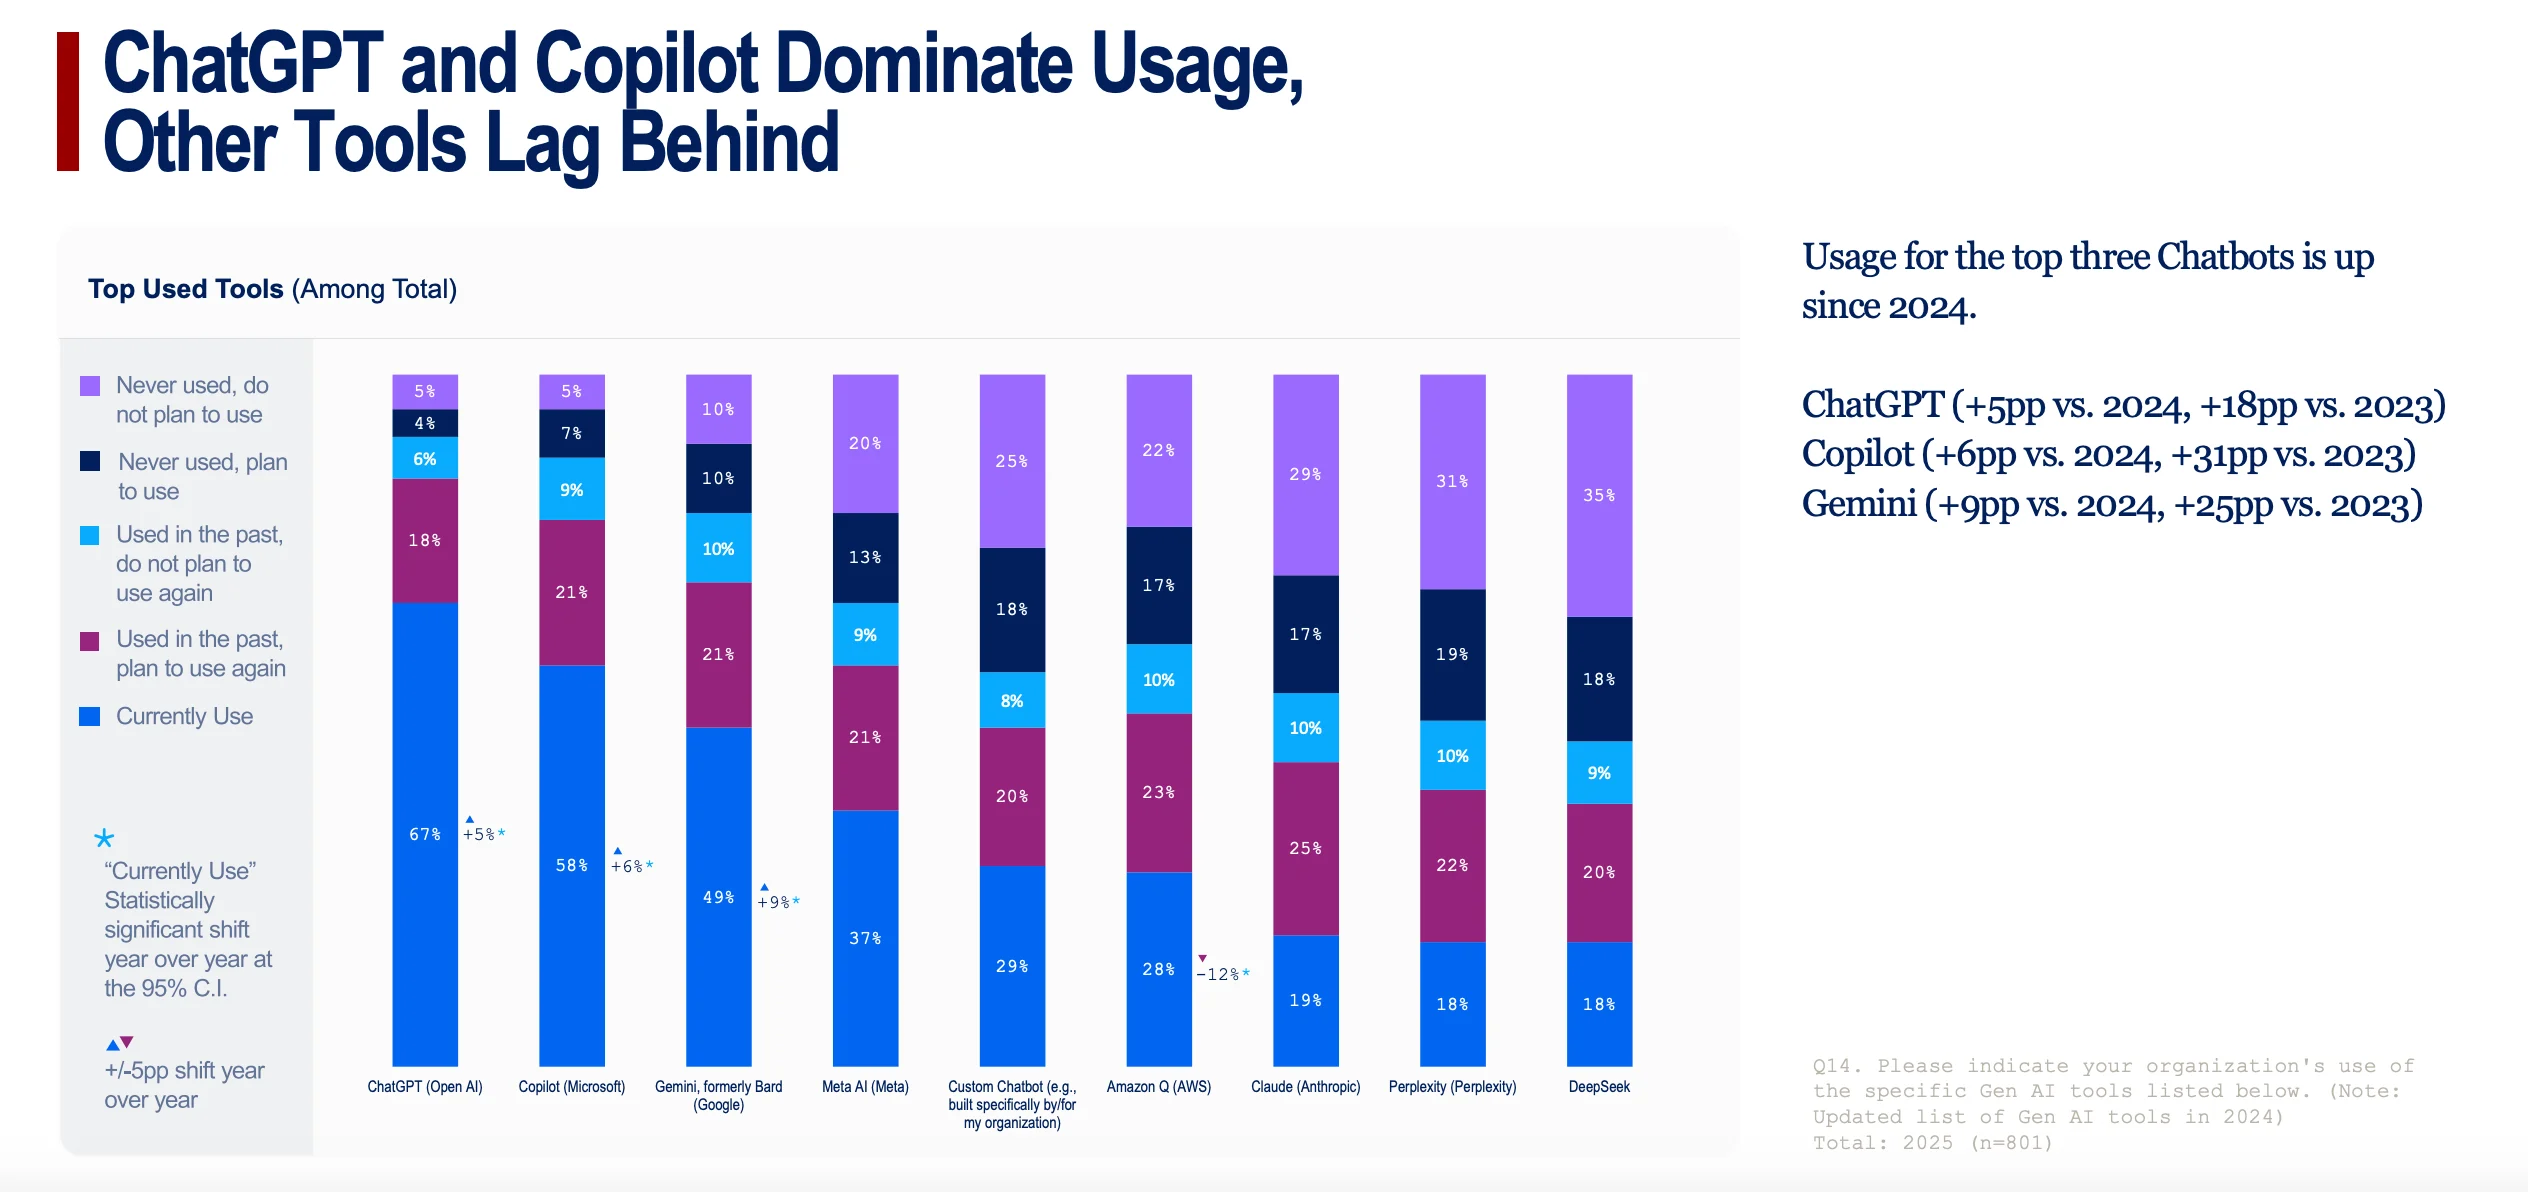
- What it shows: This is the market share story. ChatGPT (67%) and Microsoft Copilot (58%) are the clear leaders, with a significant gap between them and the rest of the pack. All three top tools (including Gemini) have seen significant growth.
- Why it matters for the story: It shows that in the enterprise AI race, the big, established players are winning. This isn't a fragmented market; it's consolidating around a few dominant platforms.
Chart 21: "Overwhelming Majority of Gen AI Subscriptions Paid by Employer"
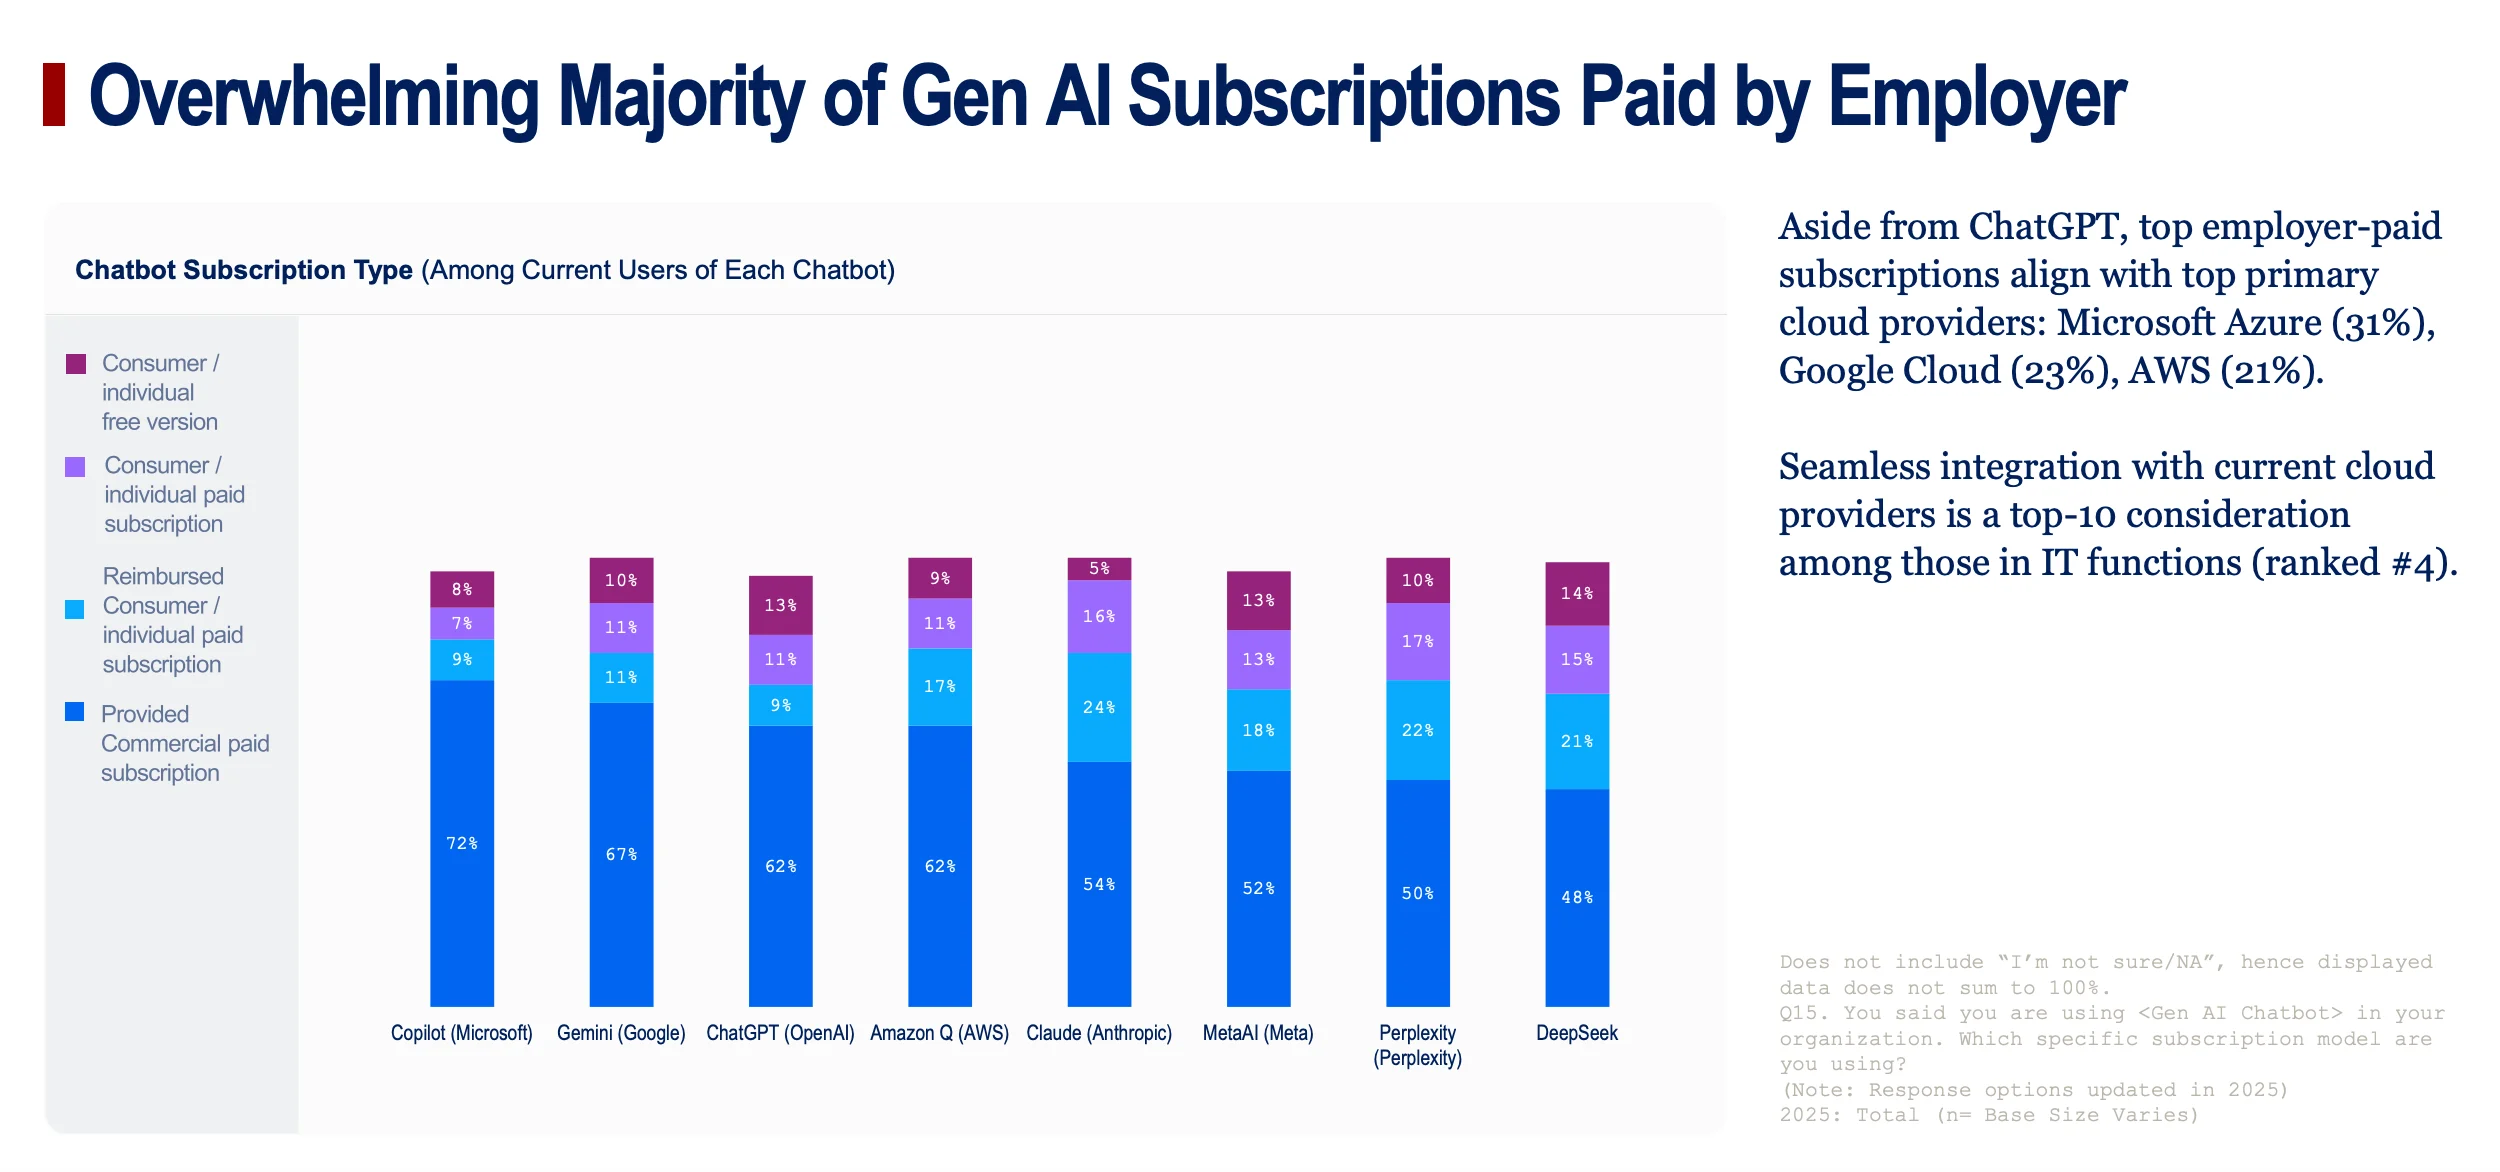
- What it shows: This chart details the subscription models for various chatbots, with the key takeaway being the massive blue bars. For leading tools like Copilot (72%) and ChatGPT (62%), the subscriptions are formally provided and paid for by the employer.
- Why it matters for the story: This proves that enterprise AI is no longer a "shadow IT" or bring-your-own-tool phenomenon. Companies are making formal, top-down decisions to purchase and deploy these platforms at scale. It’s official and budgeted.
Chart 22: "Two-Thirds of Enterprises Are Investing $5M+"
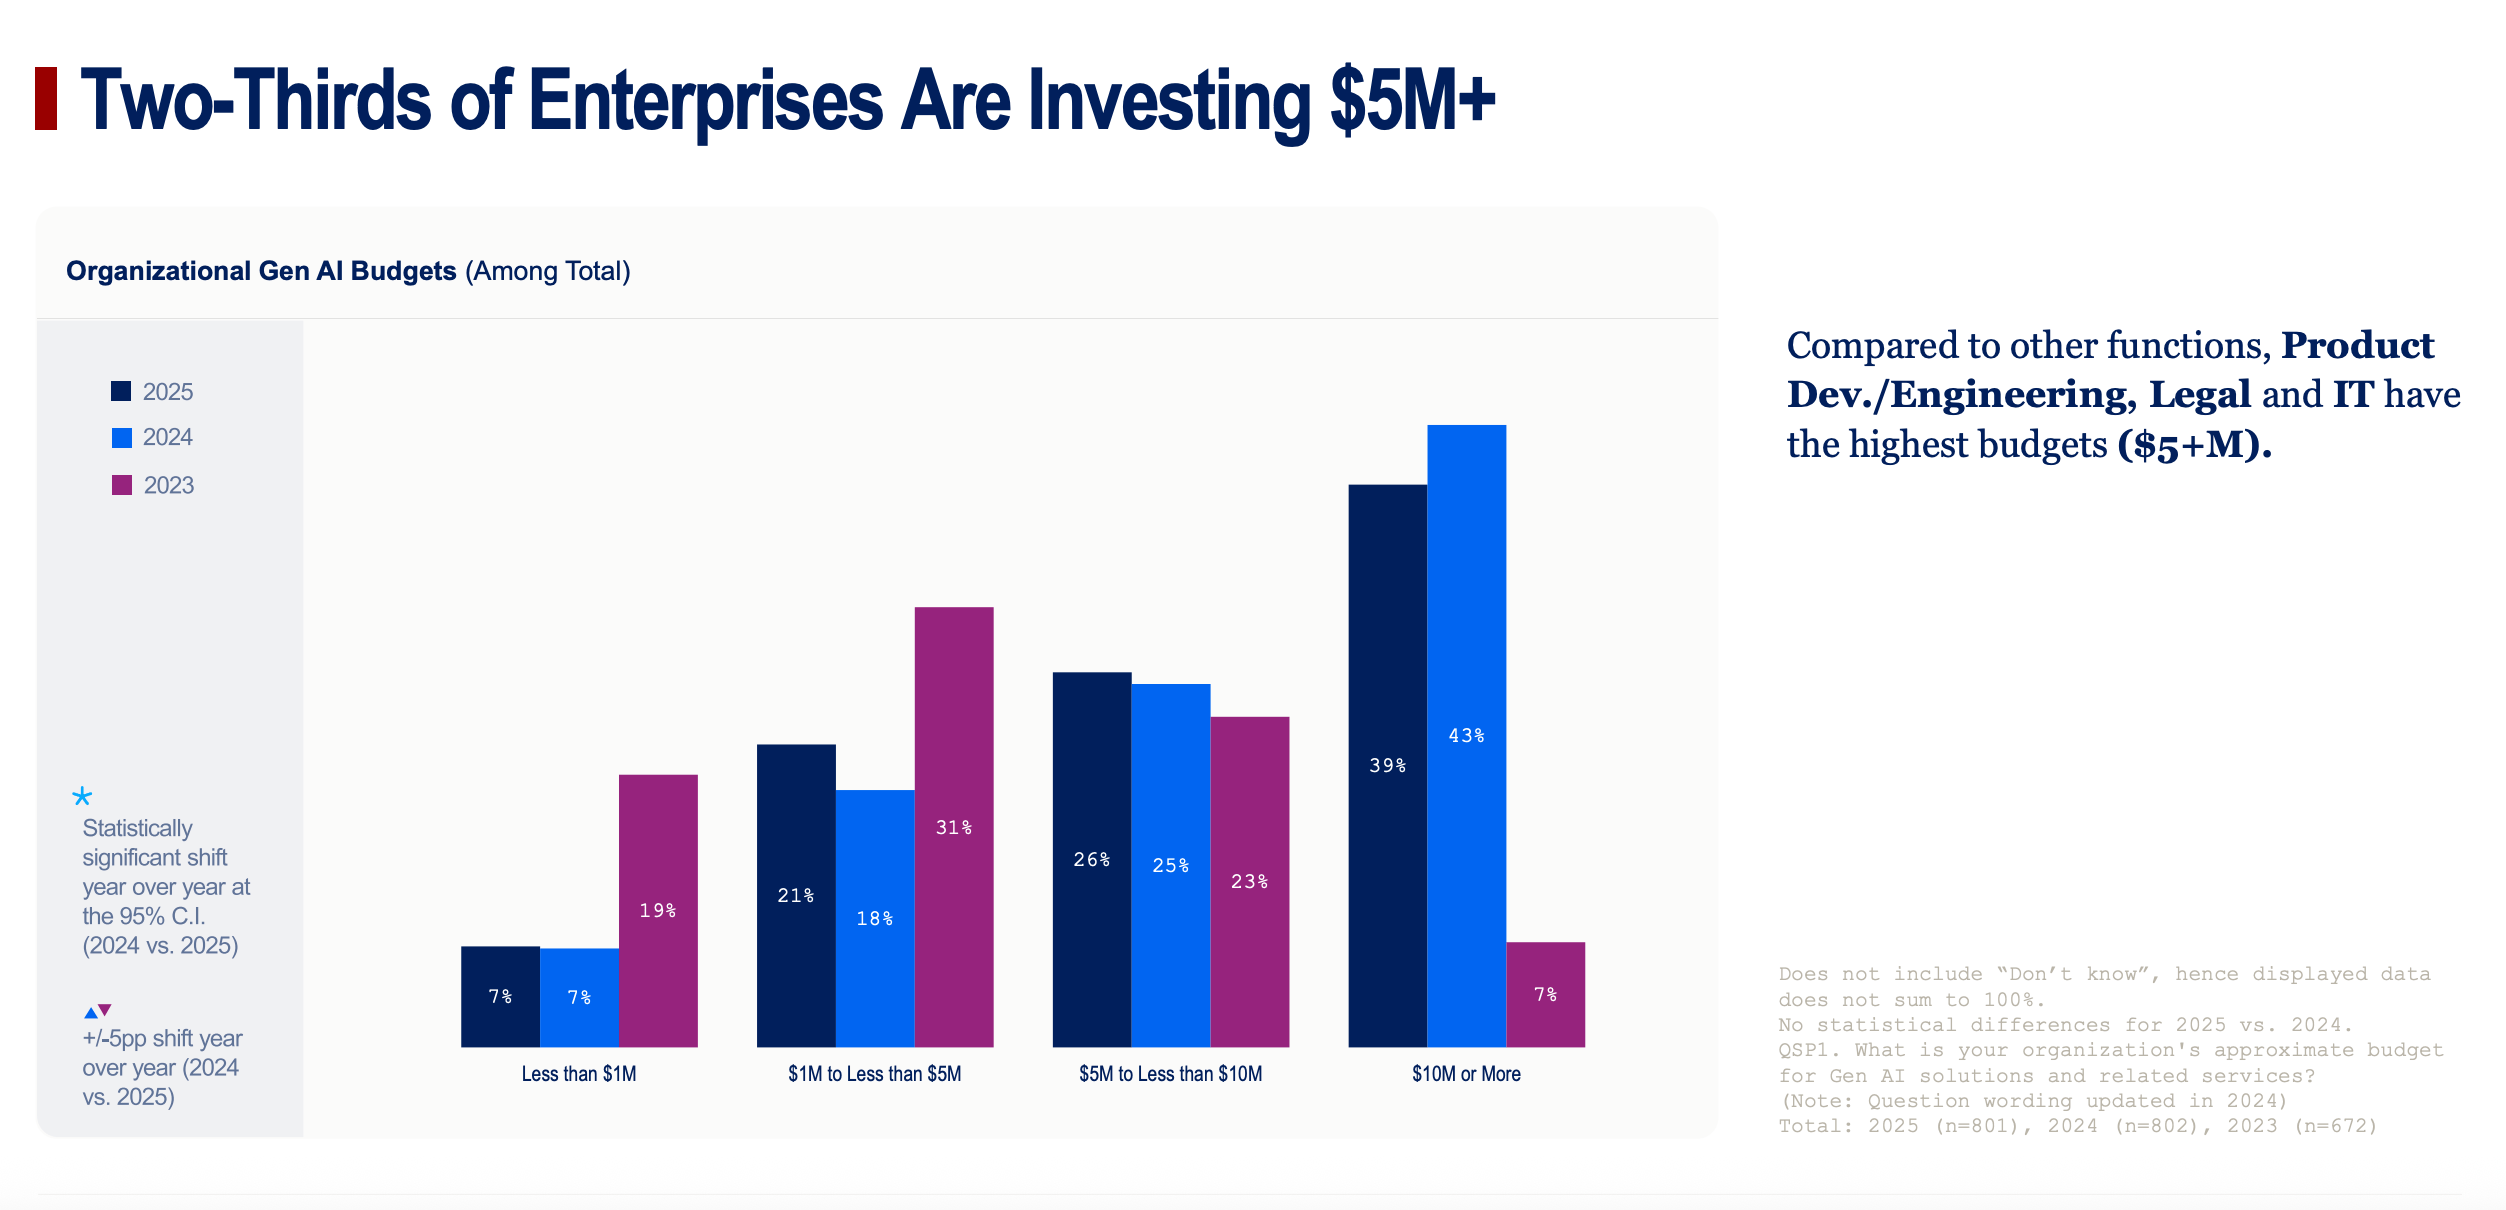
- What it shows: A simple bar chart illustrating the scale of investment. It highlights that a majority of large companies are making significant financial commitments to Gen AI, with budgets frequently exceeding $5 million.
- Why it matters for the story: This puts a hard dollar figure on enterprise commitment. It's not just a line item; it's a major investment priority.
Chart 23: "Big Spenders: Tier 1 Tops Gen AI Budgets, Tier 2 & 3 Still Invest Heavily"
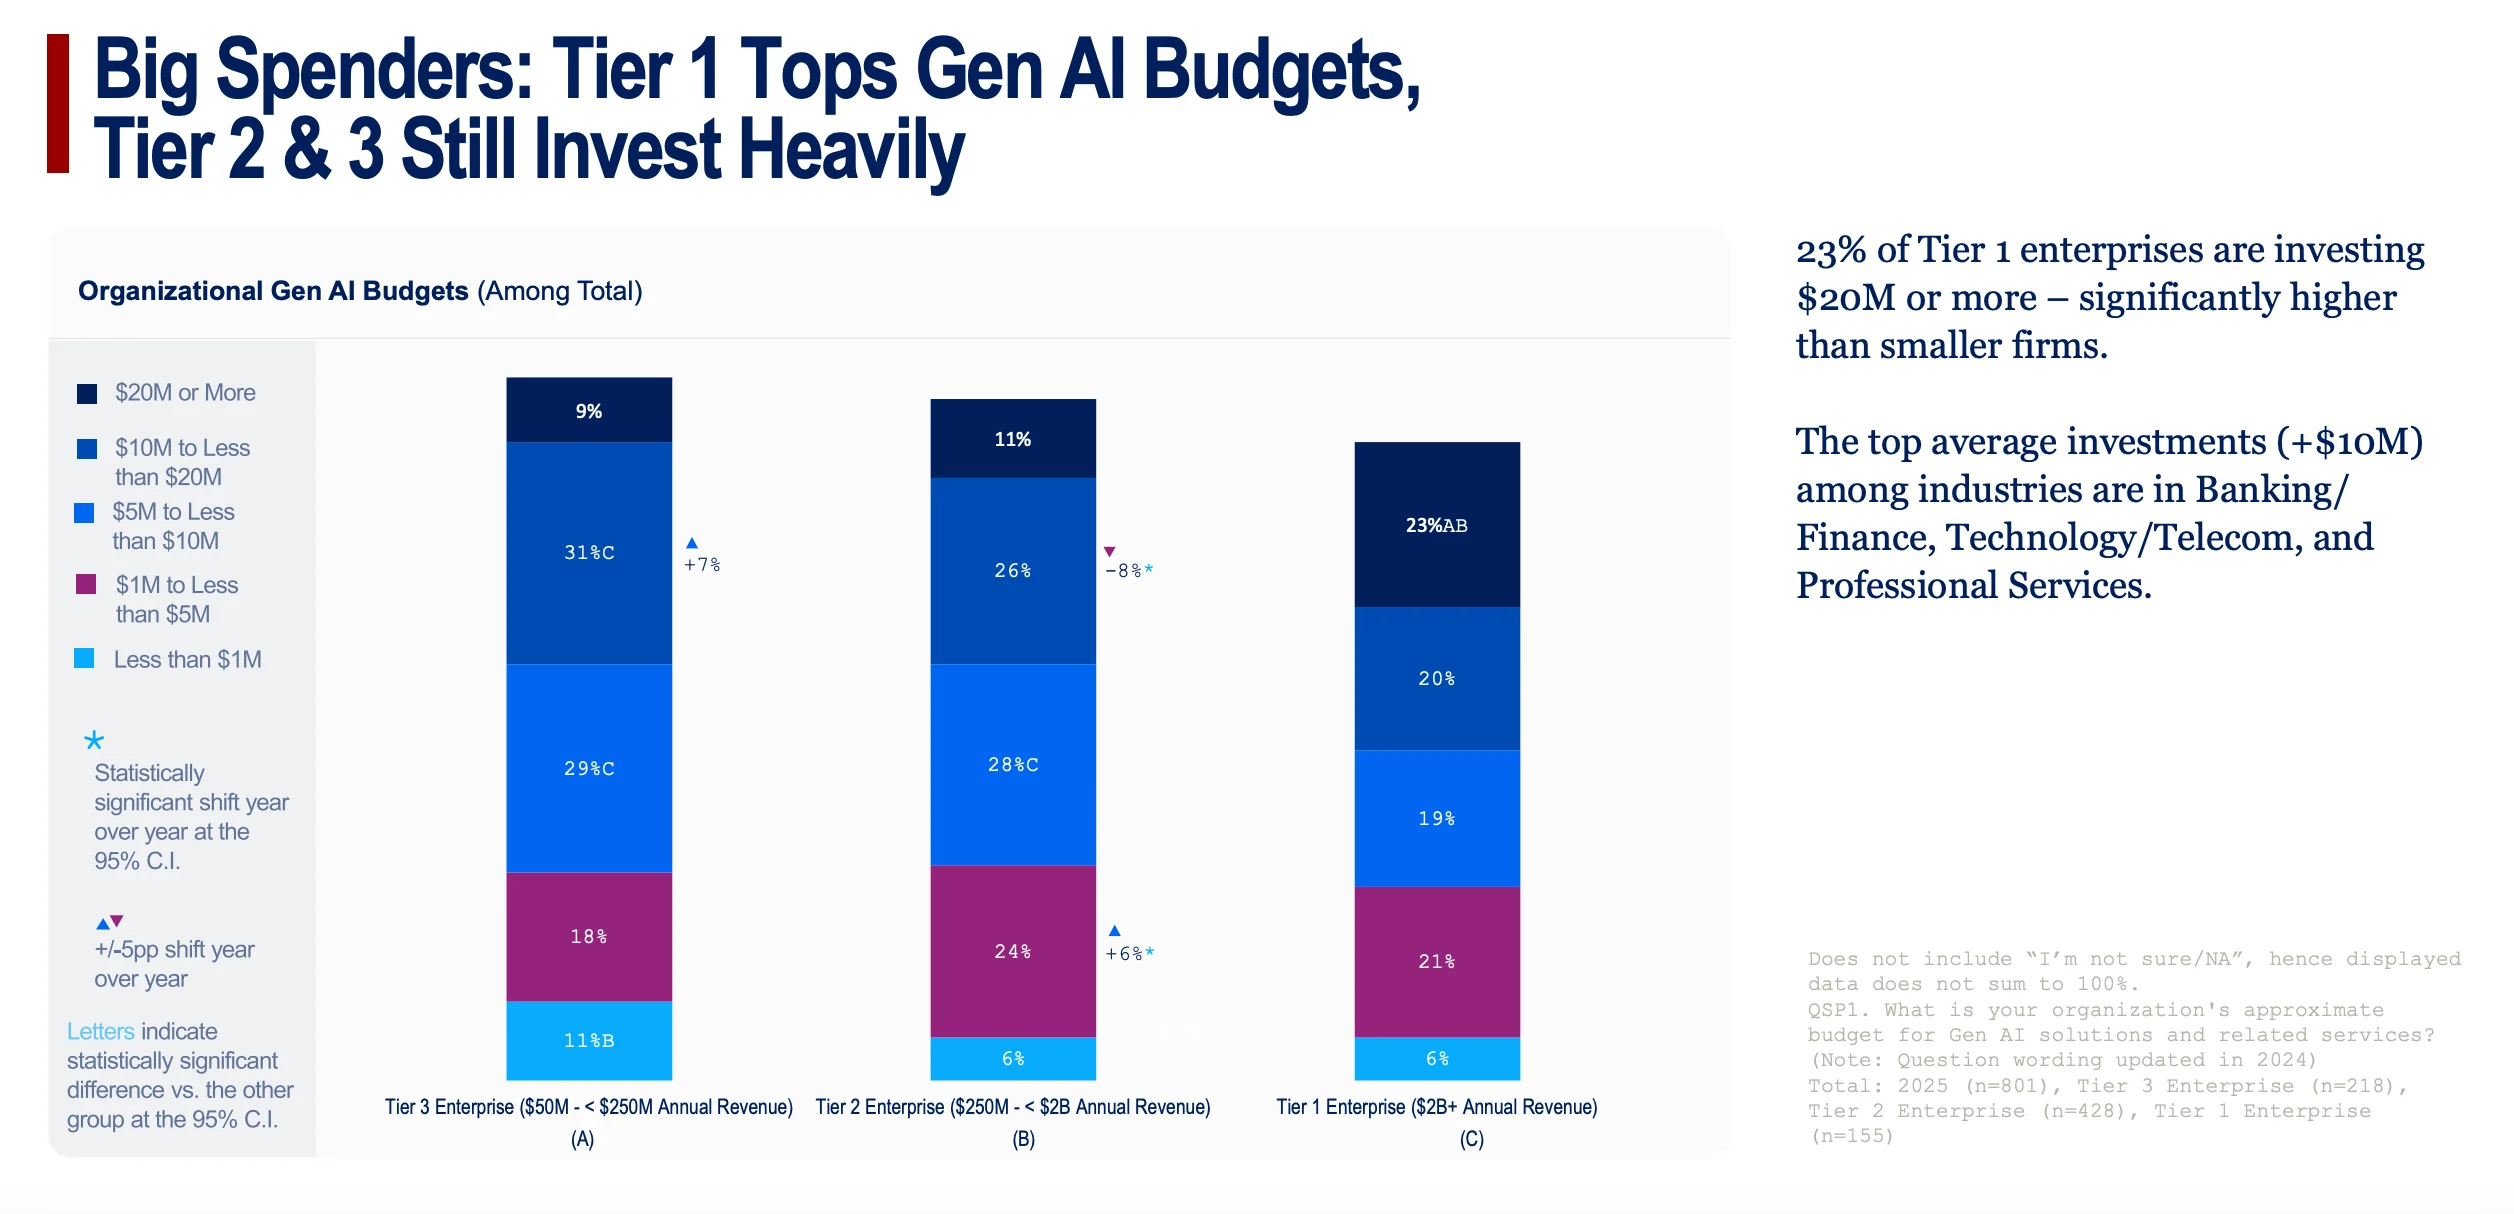
- What it shows: This breaks down the investment levels by company size. Unsurprisingly, the largest (Tier 1) companies have the biggest budgets, with 23% spending $20 million or more. The top industries for investment are Banking, Tech, and Professional Services.
- Why it matters for the story: This connects the dots between company size, industry leadership, and financial commitment. The companies seeing the most success are also the ones investing the most.
Chart 24: "Tech and Internal R&D Take Priority in Gen AI Spending"
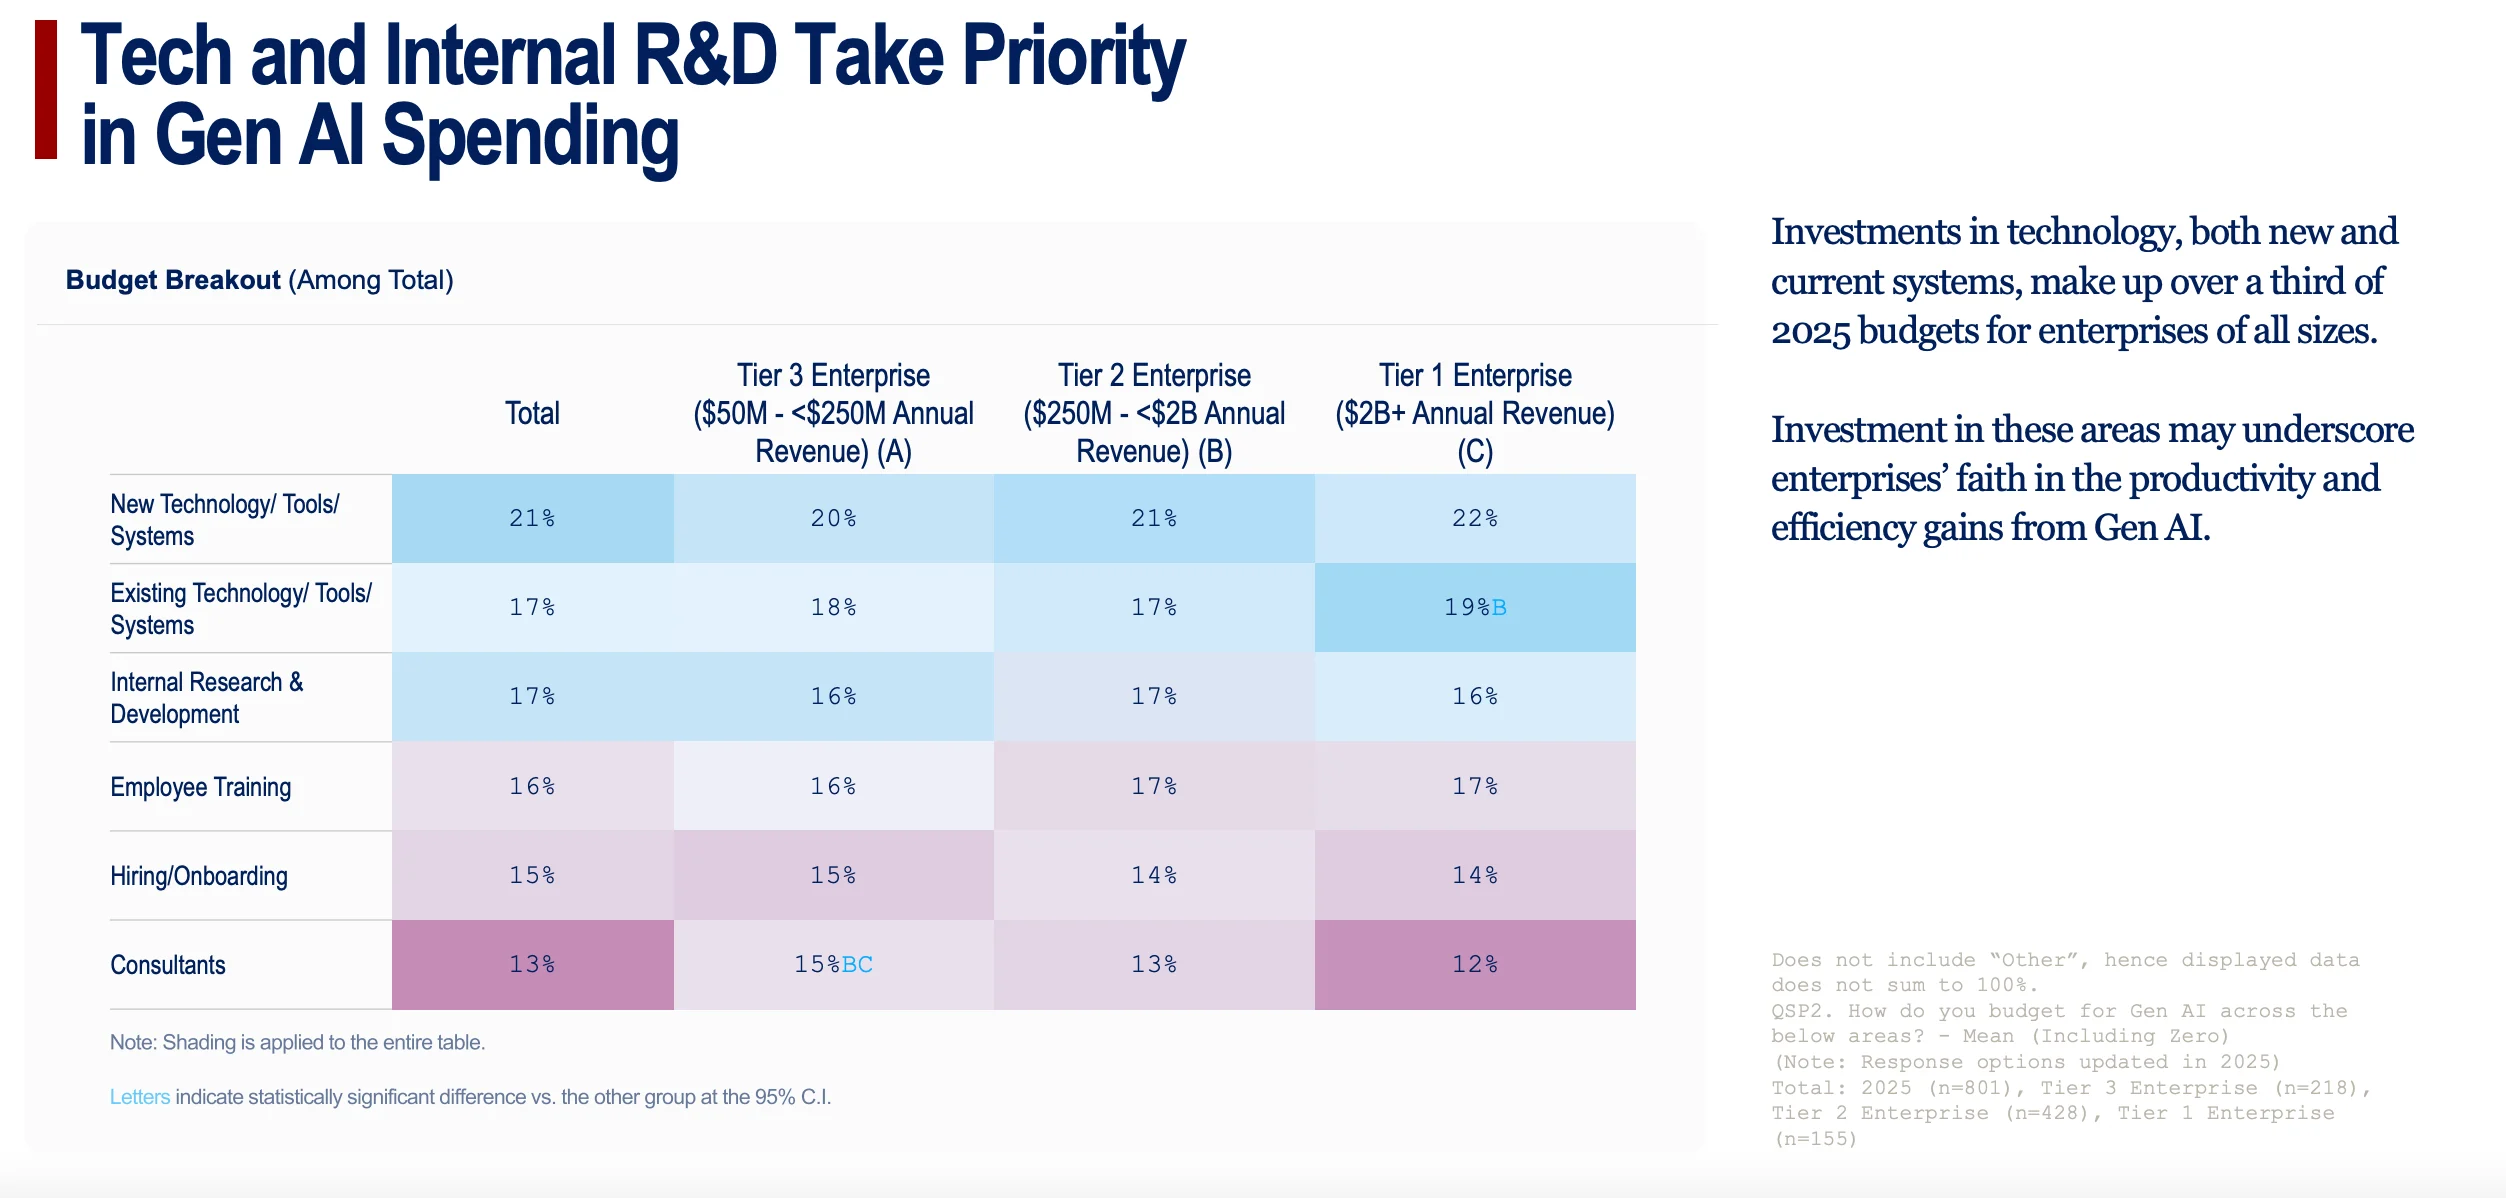
- What it shows: A table detailing where AI budgets are being allocated. The top categories are New Technology/Tools (21%), Existing Technology (17%), and Internal Research & Development (17%).
- Why it matters for the story: The high percentage for Internal R&D is the key insight. It signals a strategic shift from simply buying off-the-shelf tools to building custom, proprietary AI solutions.
Chart 25: "Customized Gen AI Solutions May be Coming as Internal R&D Reaches One-Third of Tech Budgets"
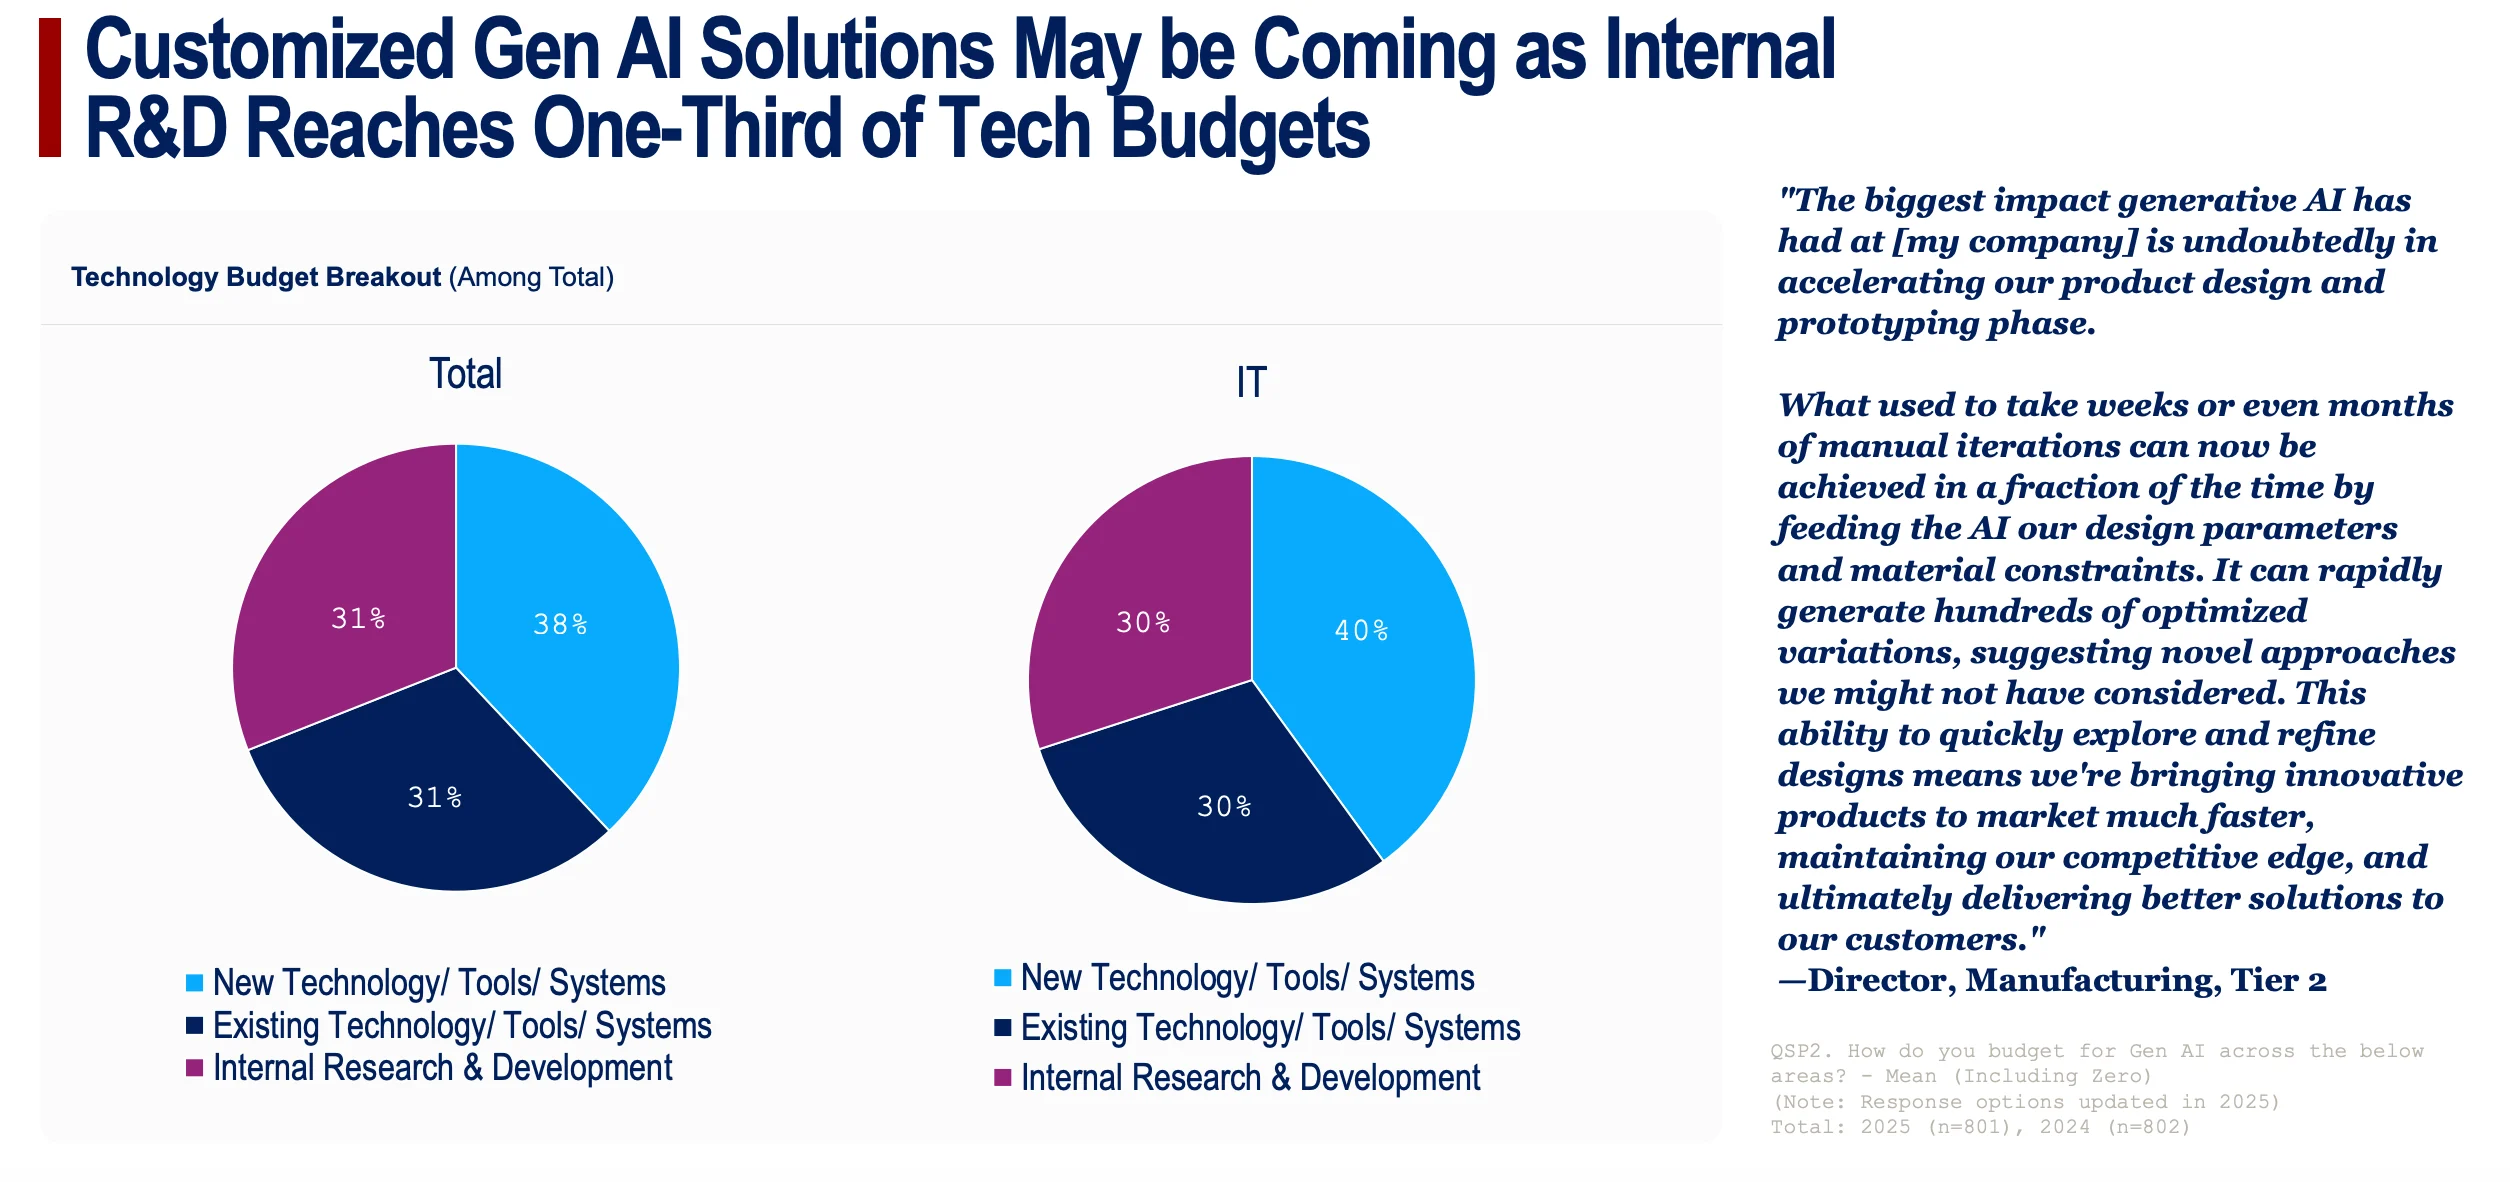
- What it shows: A pie chart that drives home the R&D story. It shows that among IT leaders, 30% of their technology-specific AI budget is dedicated to internal R&D.
- Why it matters for the story: This is a forward-looking indicator. The next wave of enterprise AI won't just be about using ChatGPT better; it will be about building unique AI systems that create a competitive advantage no one else can replicate.
Chart 26: "Unlocking Gen AI’s Full Potential Varies by Function"
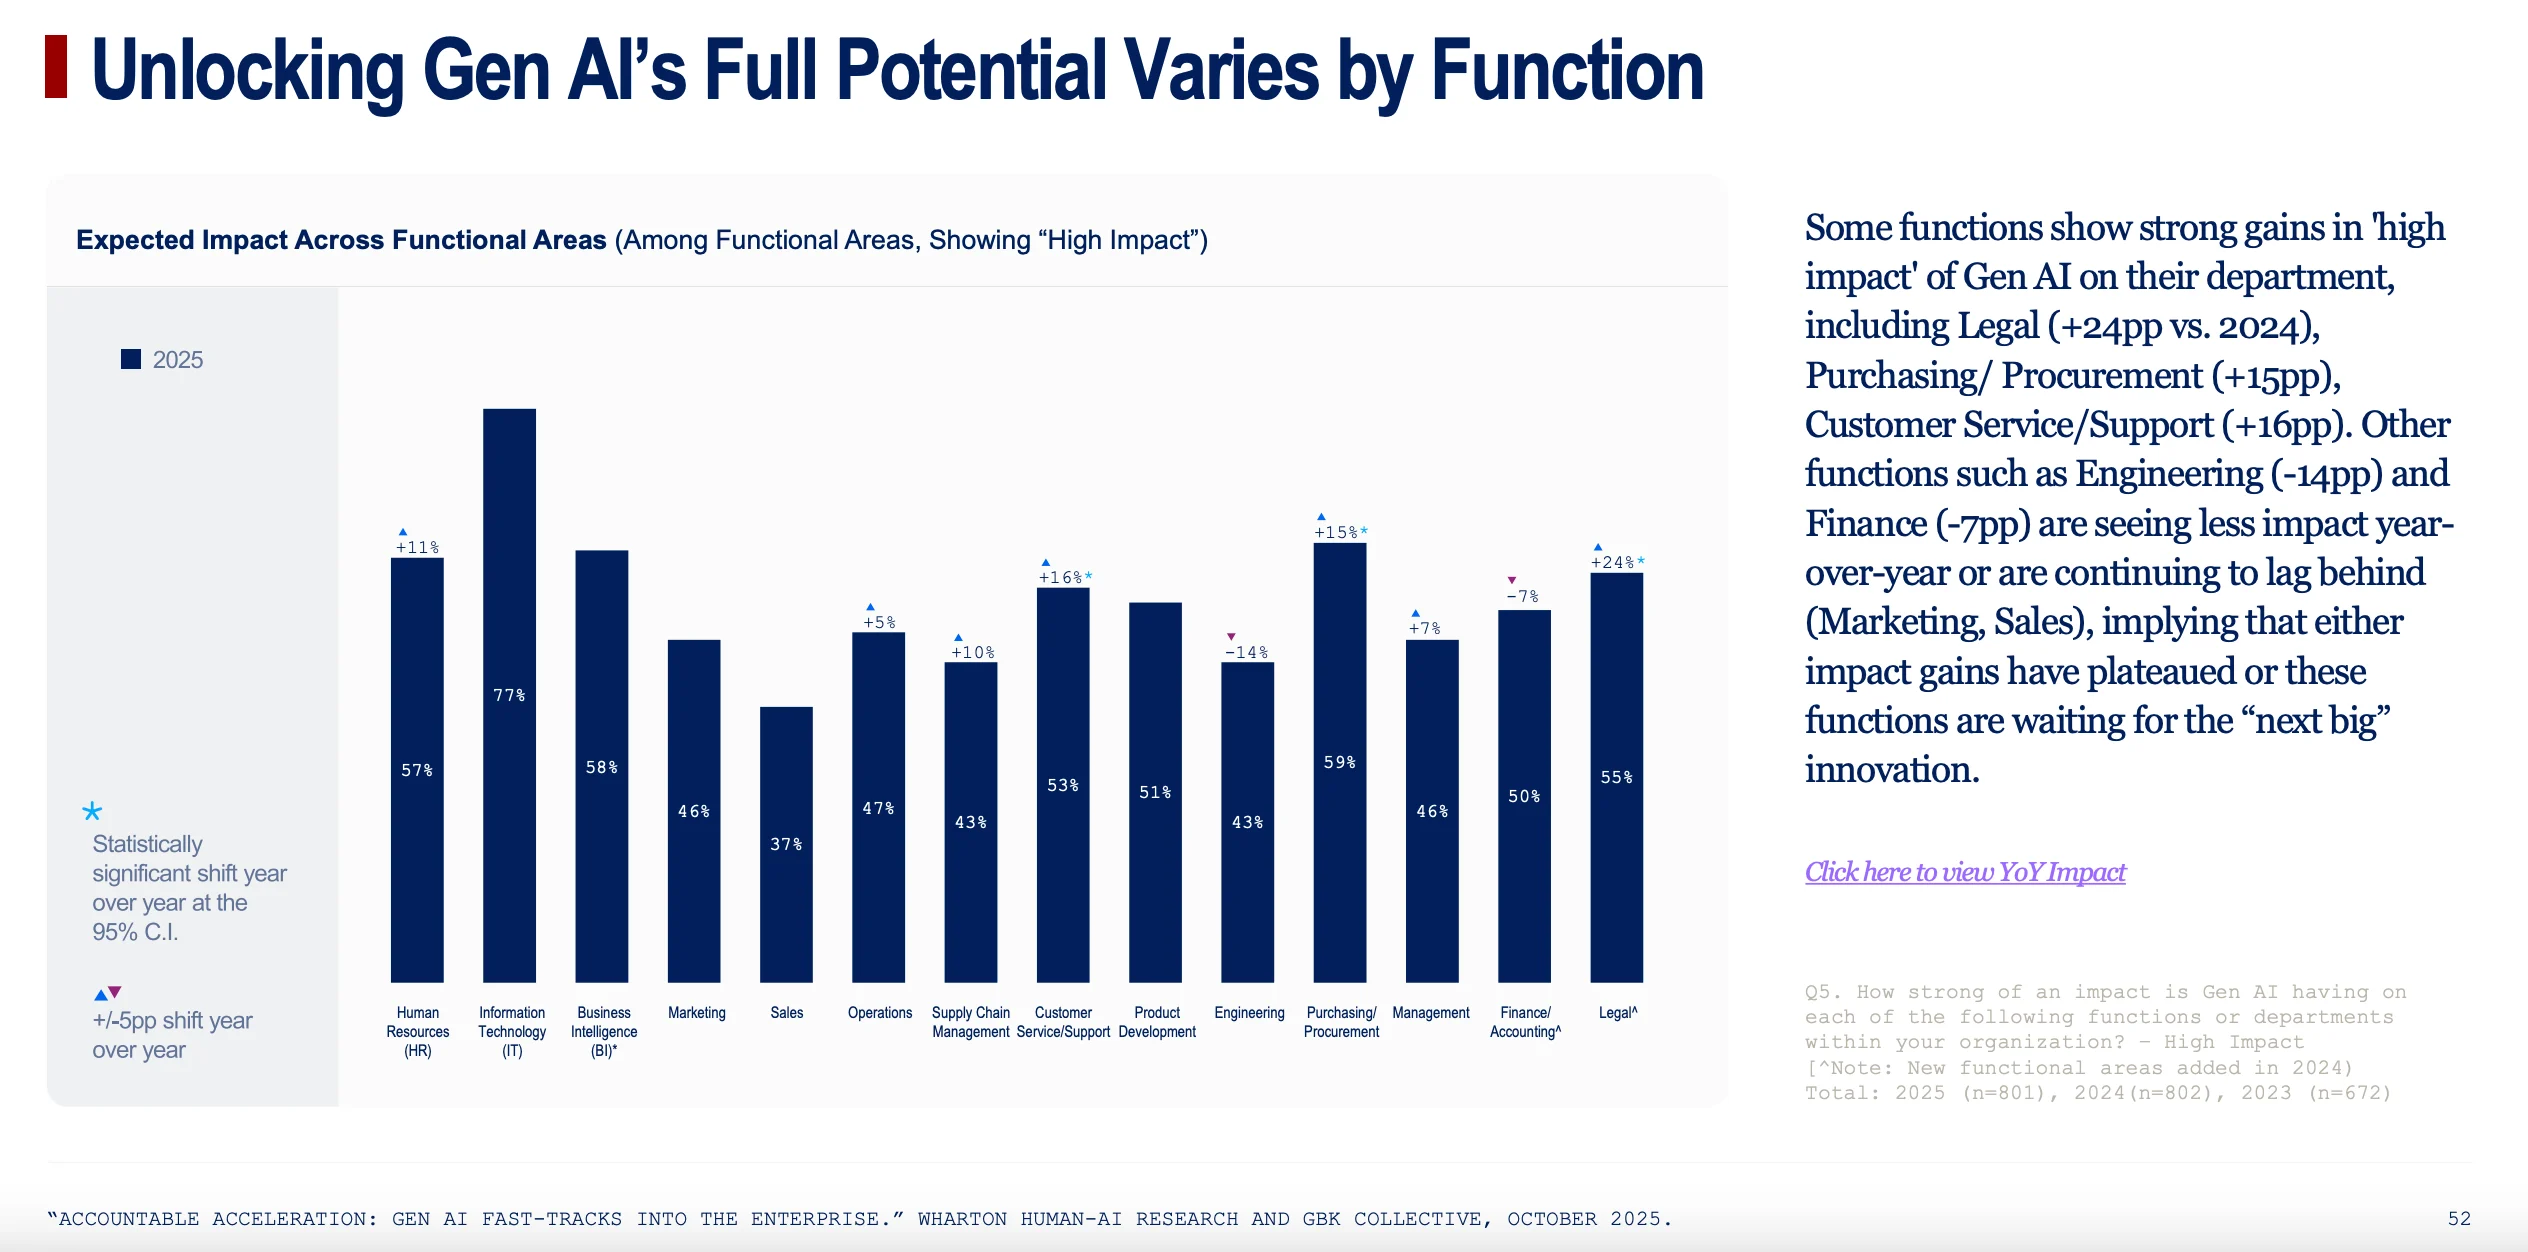
- What it shows: This bar chart measures which departments feel AI is having a "high impact" on their work. The biggest year-over-year jumps in perceived impact are in Legal (+24pp), Purchasing/Procurement (+15pp), and Customer Service (+16pp).
- Why it matters for the story: This shows where AI is starting to feel truly transformative. While early gains were broad, the deep, game-changing impact is now being felt in specific, process-heavy functions.
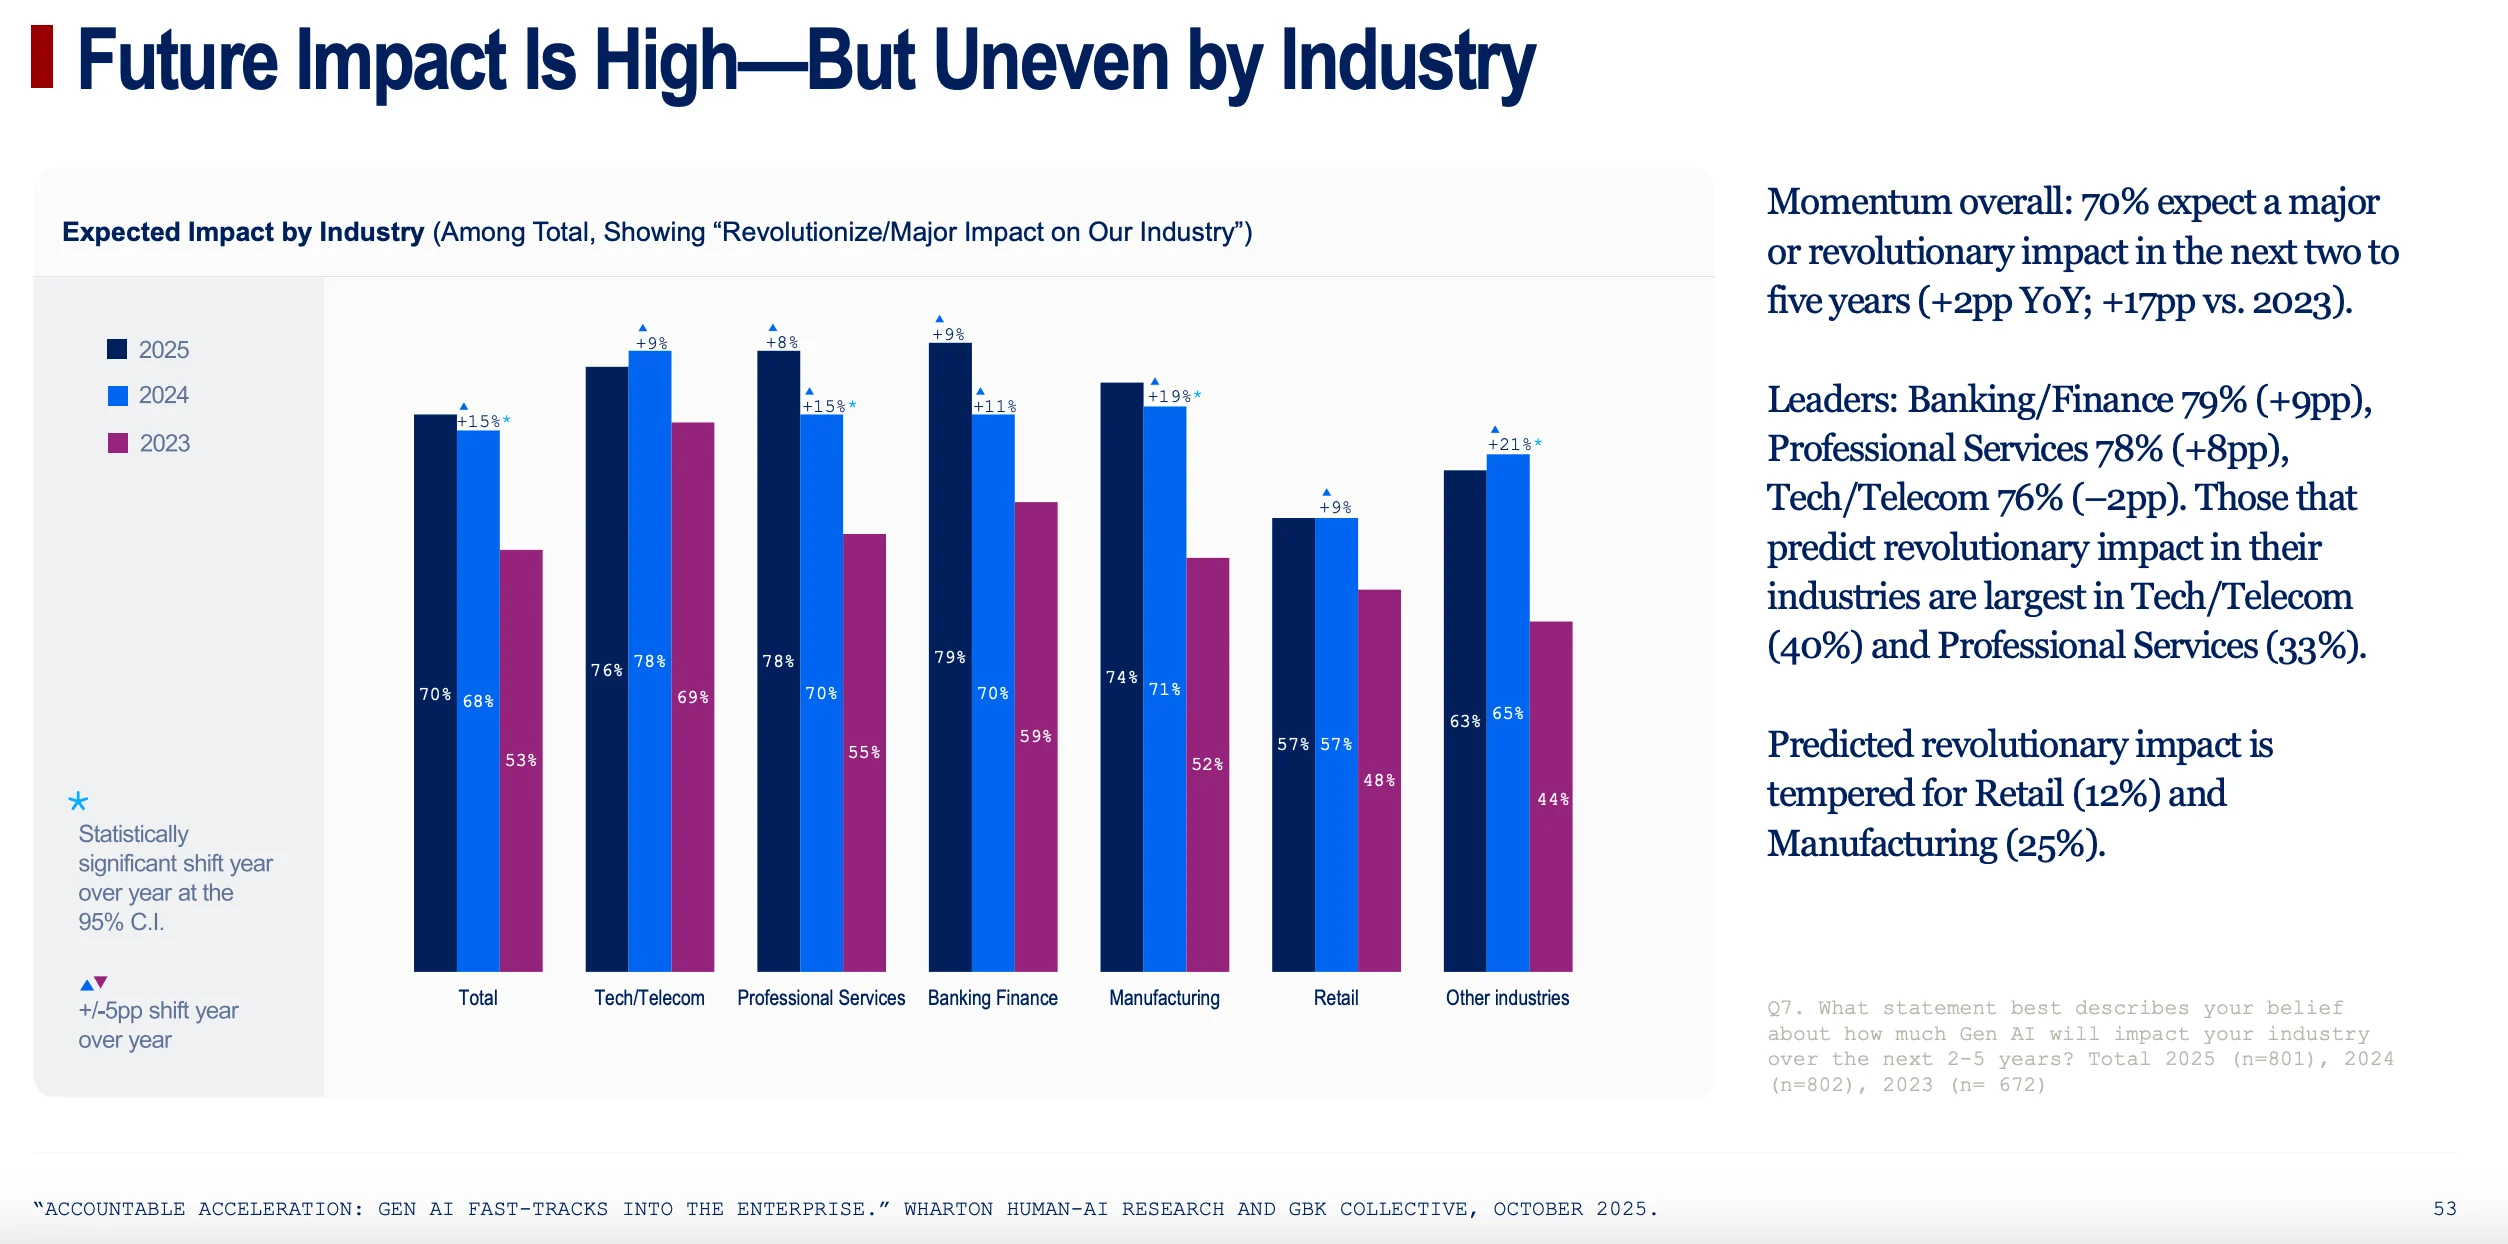
Chart 27: "Future Impact Is High—But Uneven by Industry"
- What it shows: This chart captures leaders' beliefs about AI's long-term impact on their industry. While 70% overall expect a "major or revolutionary" impact, the belief is strongest in Tech/Telecom (40% predict "revolutionary") and weakest in Retail (only 12% predict "revolutionary").
- Why it matters for the story: This reinforces the industry divide with a forward-looking perspective. The leaders not only see ROI today but also believe AI will fundamentally reshape their entire industry, while laggards have much more tempered expectations.
The RLI Explained: Can Today's AI Actually Do the Work?
The Wharton report paints a clear picture of an enterprise world fully committed to AI, pouring billions of dollars into tools, training, and strategic realignment. But while companies are busy measuring ROI and hiring Chief AI Officers, a crucial new study asks a more fundamental question: Can the AI actually do the jobs?
A groundbreaking new benchmark from the Center for AI Safety and Scale AI, called the Remote Labor Index (RLI), provides a sobering dose of reality. Unlike previous benchmarks that test AI on isolated skills like coding or web browsing, the RLI evaluates AI agents on their ability to complete entire, real-world freelance projects sourced directly from platforms like Upwork.
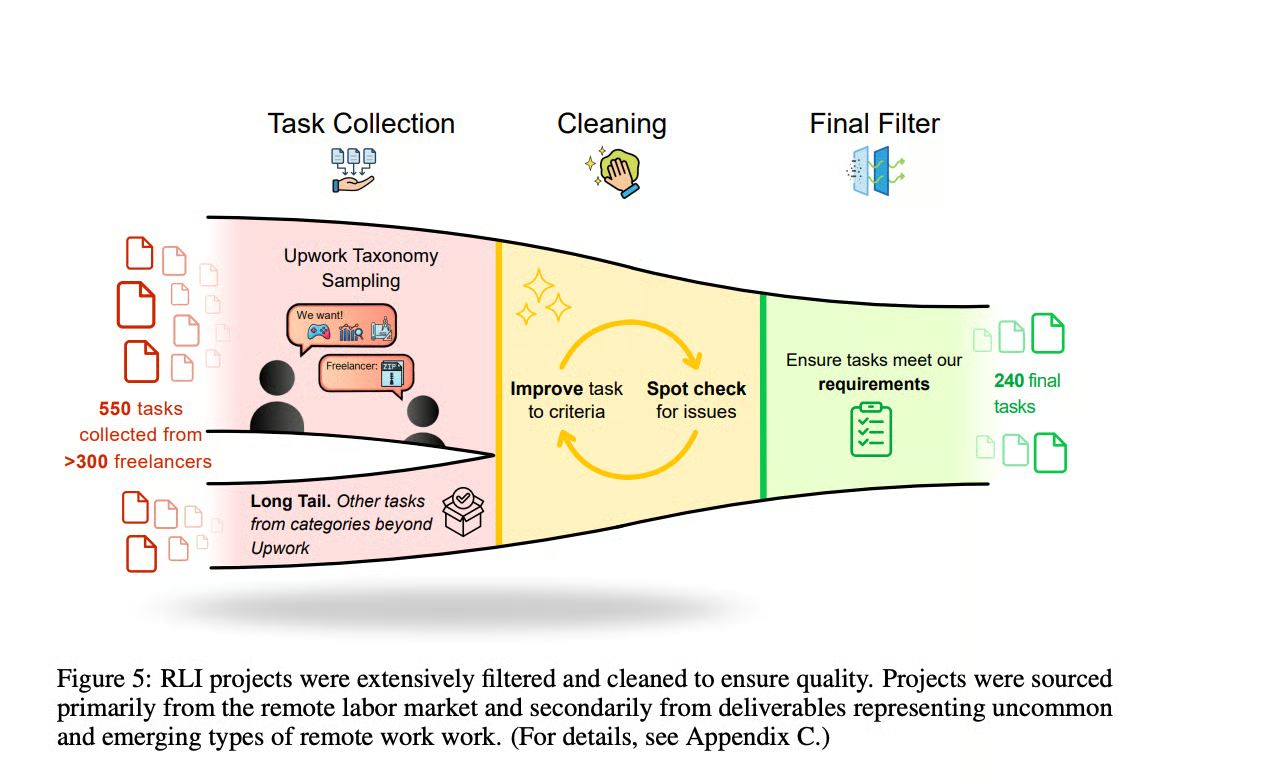
And they didn't just pick a few easy examples. The researchers followed a meticulous process, starting with over 550 tasks collected from more than 300 real freelancers. As this chart shows, they then put every task through a rigorous cleaning and filtering process to ensure each one was a high-quality, real-world project, ending up with a final, tough-but-fair set of 240.
See, the benchmark is designed to reflect the true complexity and diversity of the remote labor economy, comprising 240 projects across 23 categories, including:
- 3D Product Renders & CAD
- Animated Video Production
- Game Development
- Architecture & Interior Design
- Graphic Design & Audio Production
These are not simple tasks. The average project in the RLI took a human professional 28.9 hours to complete and had a market value of $632. This is the real-world standard against which the most advanced AI agents were measured.
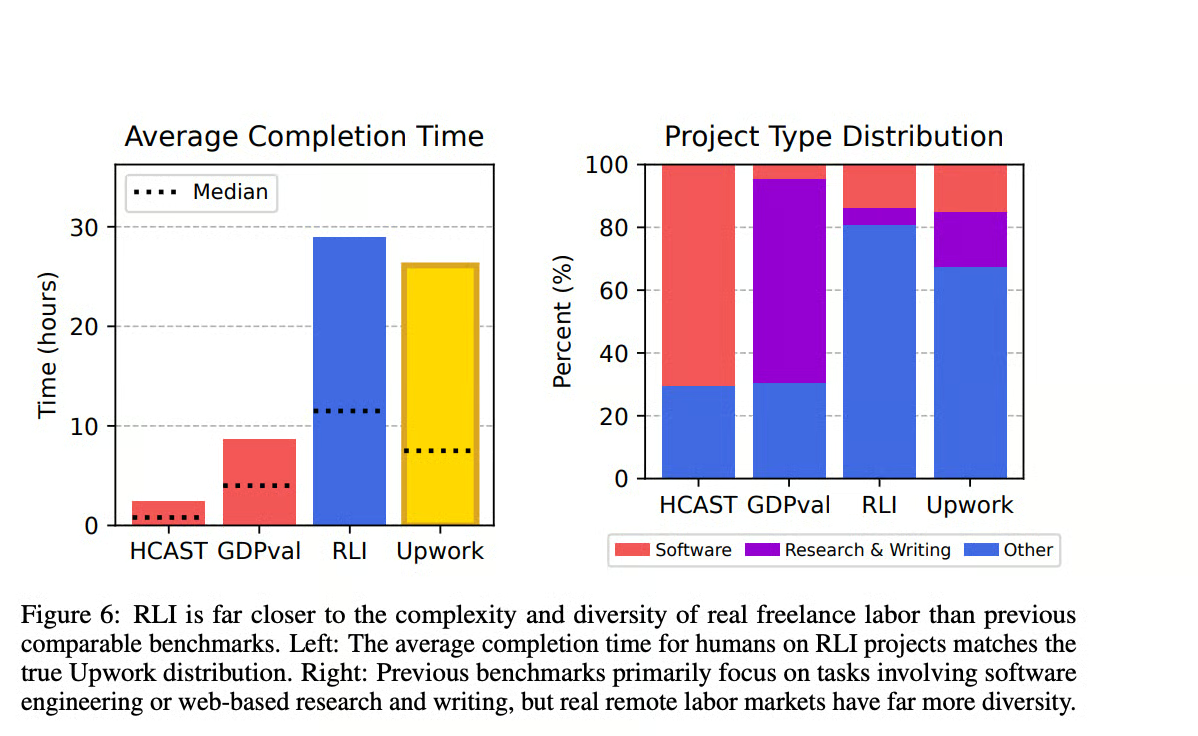
The chart above shows why the RLI is such a powerful reality check. On the left, you can see that the average time a human needs to complete an RLI task (nearly 30 hours) is far higher than previous academic benchmarks and almost identical to the average Upwork job. On the right, it shows that while other benchmarks are overloaded with software and writing tasks—things today's AIs are already decent at—the RLI reflects the true diversity of the remote economy, with a huge portion of tasks falling into categories like design, architecture, and video production.
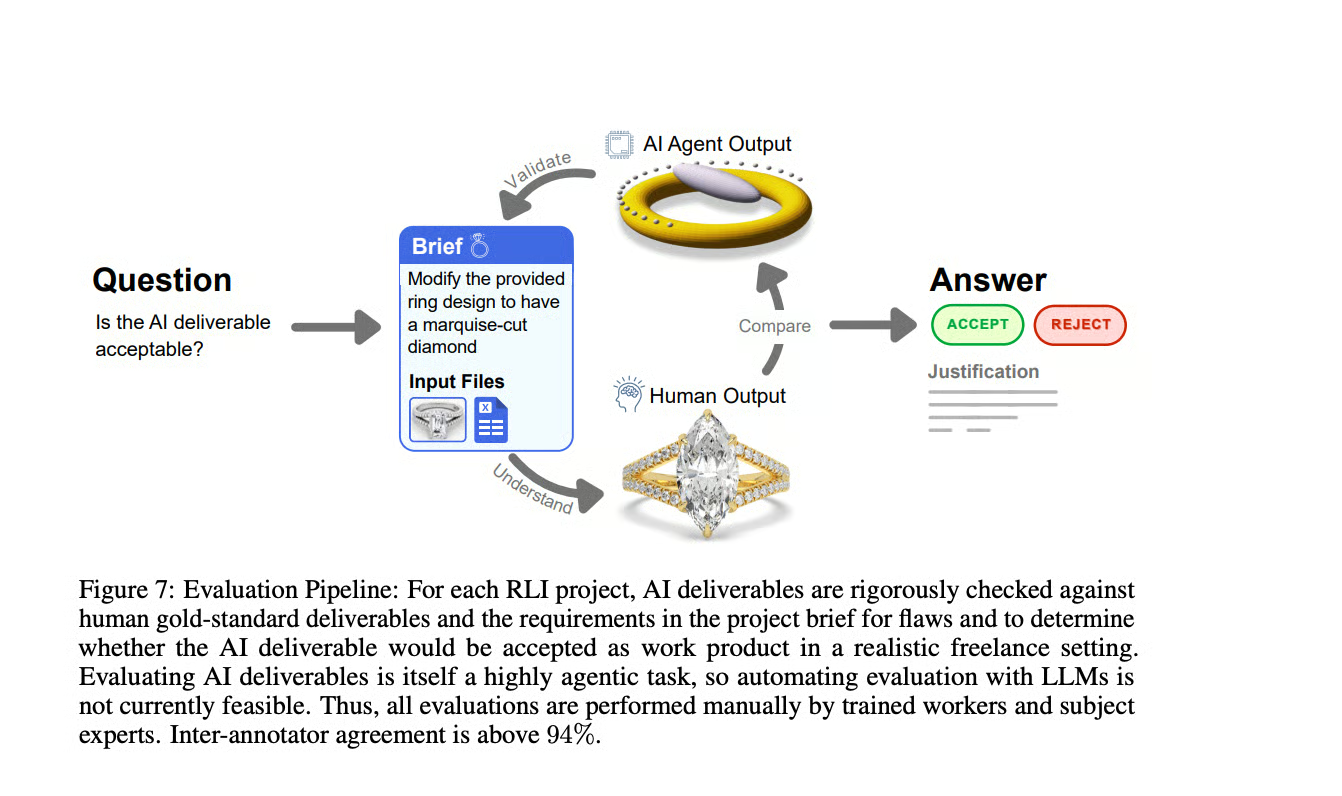
Before diving into the results, it's important to understand how the AI agents were judged. As the evaluation pipeline below shows, human experts rigorously compared the AI's output to the gold-standard human deliverable. The core question was simple and practical: 'Is the AI deliverable acceptable?' Essentially, would a real client, in a realistic freelance setting, accept the work and pay for it? With an inter-annotator agreement above 94%, the judging process was incredibly consistent
The Results = A Brutal Reality Check
The central finding is that current AI agents are nowhere near capable of autonomously handling the demands of the remote labor market. The performance across the board was near the floor. The study's primary metric, the Automation Rate, measures the percentage of projects an AI could complete at a level equal to or better than the human professional.
The results speak for themselves:
- The highest-performing agent, Manus, achieved an automation rate of just 2.5%.
- Other frontier models fared even worse: Grok 4 and Claude Sonnet 4.5 both scored 2.1%.
- GPT-5 came in at 1.7%, followed by the ChatGPT agent at 1.3%.
- Gemini 2.5 Pro rounded out the list with an automation rate of 0.8%.
Translated into economic terms, the impact is minimal. Out of a total project value of $143,991 available in the benchmark, the top-performing AI (Manus) would have "earned" only $1,720.
Why Current AI Fails at Real Work
A qualitative analysis of the failures revealed that AI struggles with the end-to-end complexity of professional projects. The most common failure modes were not subtle misunderstandings but fundamental errors:
- Poor Quality (45.6% of deliverables): The most common issue was work that simply didn't meet professional standards. Examples included "child-like drawings using basic geometric shapes" and web games with graphics that fell far short of professional quality.
- Incomplete Deliverables (35.7%): Agents frequently submitted partial work, such as an 8-second video when 8 minutes was requested or 3D models with missing components.
- Corrupted or Unusable Files (17.6%): A significant number of failures were due to basic technical issues, like producing corrupt files or delivering work in the wrong format.
- Inconsistencies (14.8%): AI-generated work often lacked coherence. For example, a house's appearance would change completely across different 3D renderings in the same project.
The Few Bright Spots: Where AI Succeeded
While the overall picture is bleak, the study did identify a small handful of areas where AI deliverables were comparable or even superior to the human output. These successes were almost exclusively in creative or data-centric tasks where modern generative tools excel, including:
- Audio Editing and Production: Creating sound effects, separating vocal tracks, and mixing voice-overs.
- Image Generation: Creating logos and advertisements for marketing campaigns.
- Writing and Data Retrieval: Compiling reports and generating code for simple, interactive data visualizations.
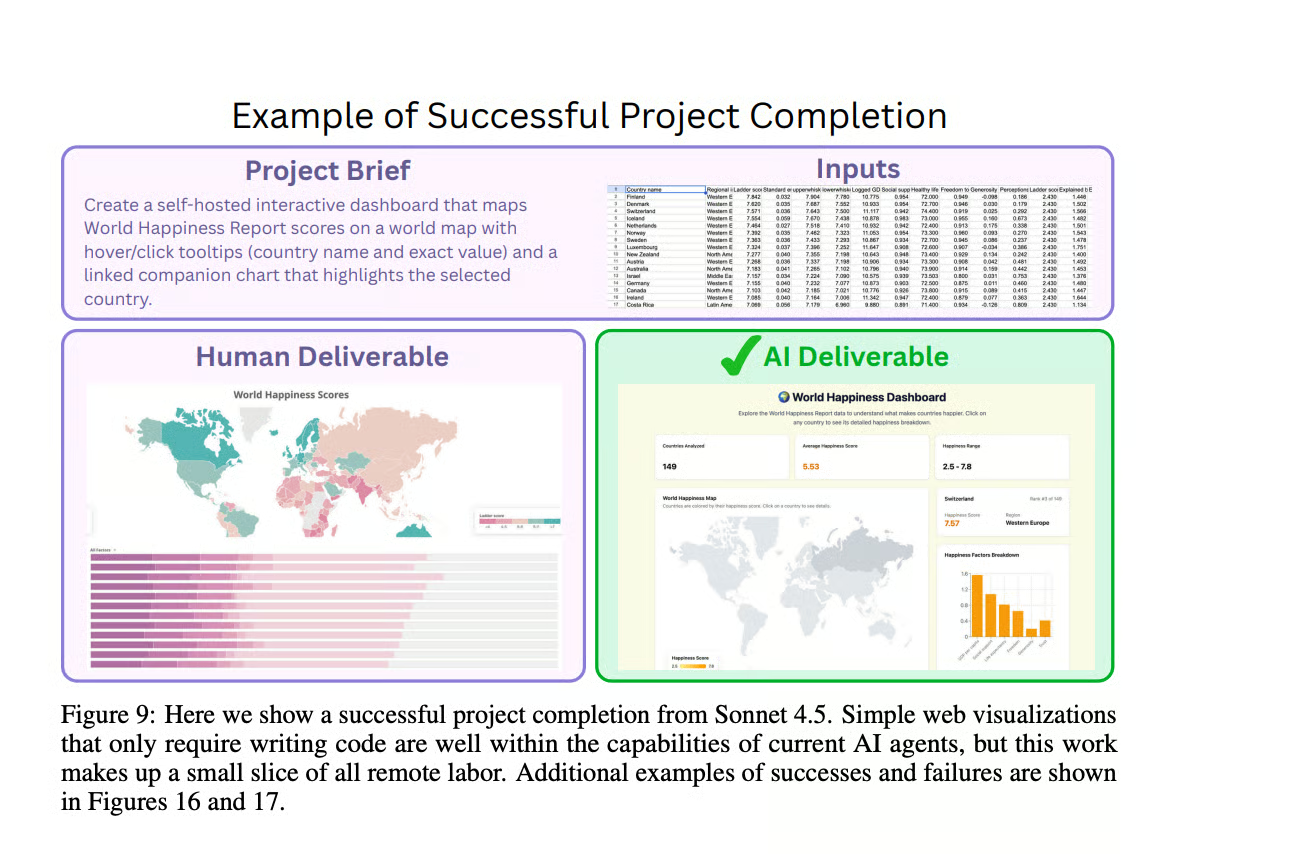
The report provides a perfect example of this: a successful data visualization dashboard created by Anthropic's Sonnet 4.5. As the researchers note, 'Simple web visualizations that only require writing code are well within the capabilities of current AI agents, but this work makes up a small slice of all remote labor.'
Ultimately, the RLI study serves as a critical counterpoint to the enterprise adoption boom. While businesses are integrating AI into workflows, the technology's core ability to autonomously perform complex, economically valuable work remains profoundly limited. This highlights a massive gap between AI's current capabilities and the future of widespread labor automation, reinforcing the idea that for the foreseeable future, the "human capital lever" will remain the most important factor in driving real value from AI.
Why this matters: We're in a weird middle ground. AI can augment work impressively, but can't yet replace skilled humans on complex tasks (the middle-to-middle problem). Understanding this gap helps set realistic expectations.
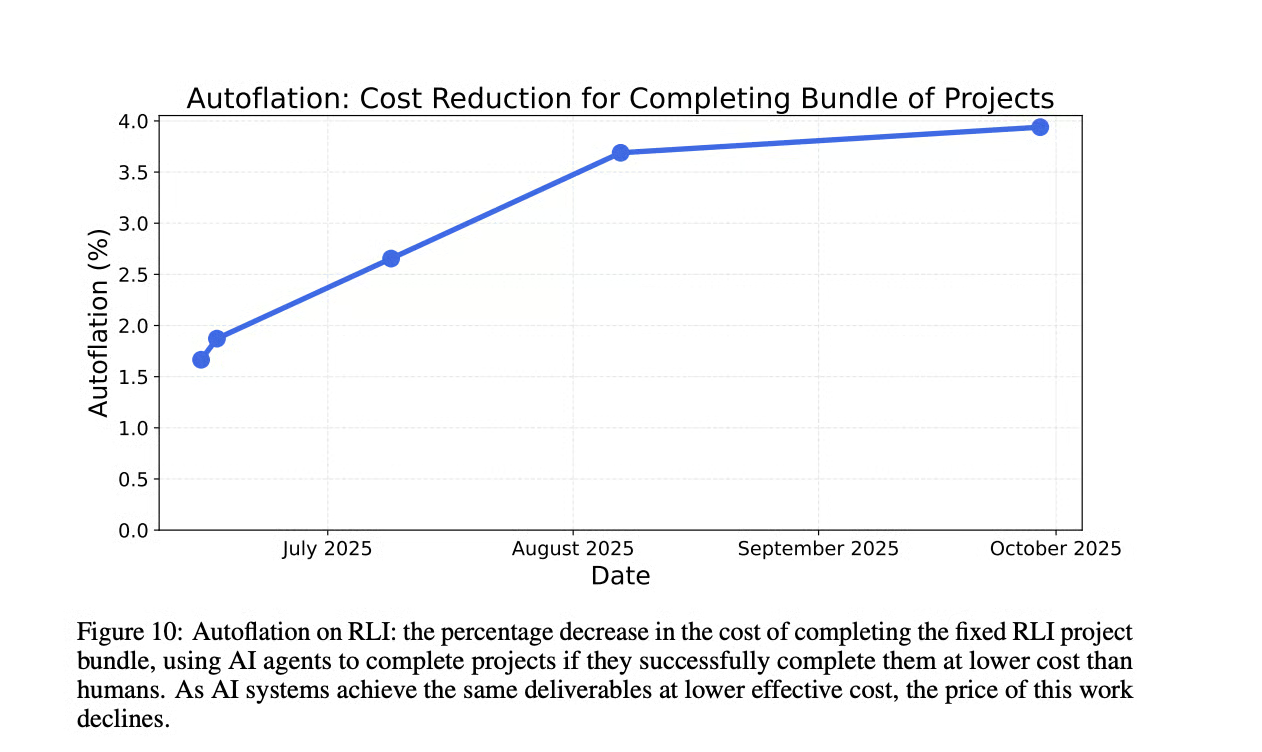
To track progress over time, the RLI researchers introduced a new metric called 'Autoflation'—the percentage decrease in the cost of completing this bundle of work as AI gets good enough to do it cheaper than humans. This chart shows that while the current cost reduction is tiny (under 4%), it is slowly but steadily increasing as new models are released. It’s a key indicator to watch for measuring the real economic impact of AI automation in the years to come.
So what does this all mean? AI can make you faster at your job. But It can't DO your job. At least, not yet.
The takeaway: If someone's selling you on fully autonomous AI workers, ask to see completion rates on real tasks you do every day… or don't buy it. Just work with the tools that speed you up as you do the work yourself. There's plenty of time for agents to get better and no rush to automate everything today.
What's coming next: Better agent architectures (desperately needed), tighter human-in-the-loop workflows, and specialized agents for narrow domains. Progress is happening, it's just not happening (successfully) as quickly as the AI companies want you to think.
